Biology Reference
In-Depth Information
A: Genome and proteome sizes
B: Properties of the human proteome
proteins expressed
in one growth
condition
proteins span >6 orders of
magnitude in abundance
~4,500
the first 40 proteins
contribute 25% of
the protein mass
mass fraction
S. cerevisiae
6,000
93.8%
5%
1%
0.2%
number
of genes
median = 18,000
20,300
90% of all proteins
occur 60-fold
around the median
copy number
proteins
expressed
in one cell type
~12,000
0
25
50
75
100
protein rank (%)
H. sapiens
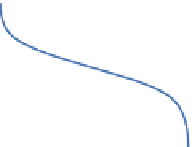
FIGURE 1.3
Properties of complete proteomes. A: Comparison of genome and proteome sizes in yeast and human. With increasing complexity of
the organism, a smaller fraction of the genome appears to be expressed in individual cells. B: The human cell line proteome spans more than six orders of
magnitude in the abundance of individual proteins. However, 90% of all proteins occur within 60-fold above or below the median copy number.
10 000 proteins each
[84]
. Although none of the above
studies employed accurate quantification strategies, the
summed and normalized peptide intensities nevertheless
allow important insights into the proteome of cancer cell
lines. One such conclusion from the 11 cell lines study, and
an earlier study that also used deep transcriptome
sequencing and large-scale imaging with an antibody
collection
[85]
, was that cellular proteomes are remarkably
similar in terms of the identity of their expressed proteins.
The expression levels even of household proteins, however,
often vary quite significantly across different cell lines
[84]
.
The dynamic range of protein expression was larger than
that of the yeast proteome and was estimated to be more than
10
6
(
Figure 1.3
B), but at the same time, about 90% of the
proteome lies within a 60-fold expression range compared to
the median level in the HeLa proteome
[84]
. Rather than
being estimated indirectly from total proteome measure-
ments, copy numbers have also been measured by more
direct methods in microorganisms
[86]
or in human cell
lines
[87]
. In the latter study, copy numbers for 40 proteins
were determined in HeLa cells and ranged from 20
their targets
[88,89]
. These studies concluded that these
effects were relatively small and dispersed to many
substrates for each different micro-RNA.
The availability of deep and accurate proteome data
also sheds new light on the longstanding question of the
extent of correlation of transcript levels with the corre-
sponding protein levels. Many early studies had found very
poor correlation between levels of mRNA and protein.
However, this seems to have been caused in large part by
the relatively primitive state of the art of transcriptomics,
and especially proteomics, at the time. The technical
imperfections of the two technologies frequently led to
incorrectly measured protein or transcript levels; however,
because they are independent of each other, this suggested
artificially low correlation of message and protein levels.
Recent studies have revealed higher correlation coefficients
for steady-state levels, generally in the range of 0.6. The
correlation of mRNA changes with protein changes is even
higher
[85,90]
. This level of correlation is biologically
plausible, given the flow of genetic information from
mRNA to protein. Nevertheless, even when there is good
correlation, the level of protein change cannot easily be
predicted from the level of transcript change. Interestingly,
a recent cell line-based study has shown that the discrep-
ancies between message and protein levels can mostly be
explained by differences in mRNA translation rates
[91]
.
However, these translation rates are themselves subject to
regulation, which cannot easily be measured without
determining protein levels and protein turnover.
More fundamentally, a major potential of proteomics is
that it can measure the protein expression levels as a func-
tion of subcellular compartment, as well as the redistribu-
tion of the proteome between compartments as a function
>
10
6
for
the cytoskeletal protein vimentin to 6000 copies for the
transcription factor FOS. Such data can now be generated
quite accurately and readily, and should greatly assist in
estimating parameters for systems biologic models.
Although proteomics is still in the process of
approaching comprehensiveness, by its nature it can answer
many questions that are outside of the scope of transcript-
based gene expression studies. The reason for this is that
the proteome integrates the effects of post-transcriptional
regulation as well as regulation by targeted protein degra-
dation. As an example, two studies have used proteomics to
delineate the effects of micro-RNAs on expression levels of