Civil Engineering Reference
In-Depth Information
2
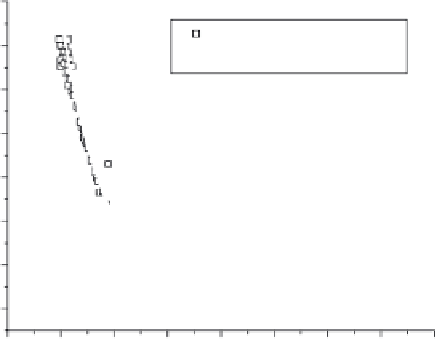
CF13
The curve of ExpDec it
0
-2
y
= 12.39exp(-
x
/14.84) -11.00
R
2
= 0.9471
-4
-6
-8
-10
-12
-20
0
20
40
60
80
100
120
140
e
2
(
)
με
4.11
Relationship between FCR and
ε
2 of CF 13.
10
BF28
The curve of ExpDec it
5
y
= 13.45exp(-
x
/68.90) -16.11
0
2
= 0.8813
R
-5
-10
-15
-20
0
50
100
150
200
250
300
e
2
(
με
)
4.12
Relationship between FCR and
ε
2 of BF 28.
• The correlation coeffi cient
C
R
2
of NCB03, NCB04, CF10, CF13, BF14
and B24 is higher than 0.9. The relationship between FCR and the strain
of IGNA is therefore very strong when correlated with Eq. [4.4], and
the self-diagnosis of damage could be more effective, particularly in
concrete components with the conductive admixtures suggested above.
• The curves in Figs 4.9-4.12 demonstrate a monotonically decreasing
relationship between FCR and the strain of IGNA.


Search WWH ::

Custom Search