Civil Engineering Reference
In-Depth Information
100
14
12
80
10
60
8
6
40
4
20
2
0
0
0
500
1000
1500
2000
2500
t (s)
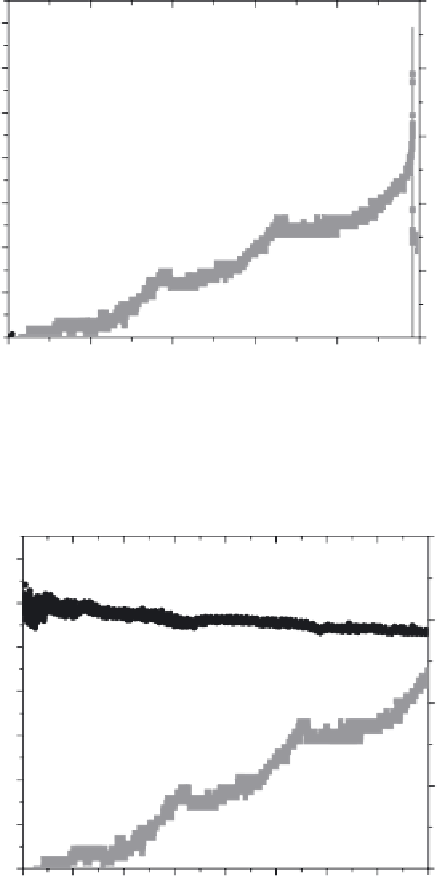
4.7
Variation of strain of IGNA (
) with load (•) vs time before
cracking.
80
1400
1200
60
1000
800
40
600
400
20
200
0
0
0
300
600
900
1200
1500
1800
2100
2400
t (s)
4.8
Resistance (•) vs strain of IGNA (
) and time.
IGNA; the unit of
X
is in
, and the FCR is the percentage of
Y
. The
applied parameters and the correlation coeffi cient
C
R
2
are illustrated in
Table 4.7. The correlation coeffi cients of all beams in Table 4.7 range from
0.5 to 0.978. From Figs 4.9-4.12 and Table 4.7, it may be seen that:
με


Search WWH ::

Custom Search