Civil Engineering Reference
In-Depth Information
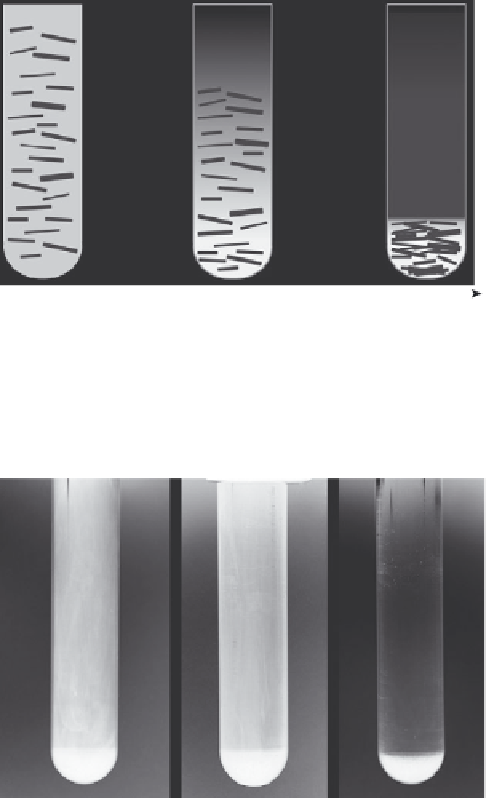
Ultracentrifugation time
3.7
Schematic fi gure showing the progression of the sedimentation of
nano-materials inside a tube during ultracentrifugation (Metaxa
et al.
,
2012).
(a)
(b)
(c)
3.8
Suspensions of carbon nanotubes ultracentrifuged for (a) 30 min,
(b) 45 min and (c) 60 min (Metaxa
et al.
, 2012).
tion quantity,
A
, is measured by the particle size. The agglomeration per-
centage is critical because, in certain cases, dispersion between two images
can be identical, although the agglomeration percentage will have changed.
In both cases, a quantifi able percentage is calculated based on the statistical
probability that either the free-path spacing or particle size will fall within
a certain percentage above and below
l
, where
l
is either the mean spacing
or the particle size. A high value of
D
indicates a better dispersion. A lower
value of
A
indicates a reduction in agglomeration.
Search WWH ::

Custom Search