Geography Reference
In-Depth Information
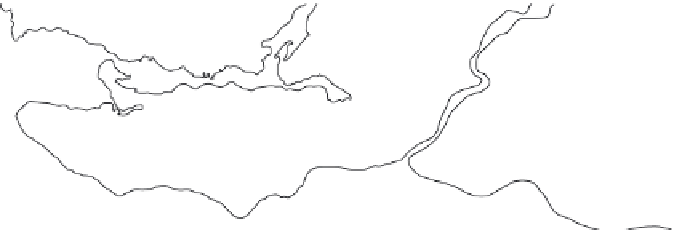
Figure 5.6
Distribution in 1996 of self-designated ethnic Chinese, landing in Canada 1986-96,
Vancouver CMA
Old Chinatown-Strathcona has been largely by-passed by the new migrants,
the destination of only 520 of the 37,000 new households. It is in fact quite
peripheral to the new map of residential selection. Vancouver's expensive
Westside neighbourhoods are prominent on that map, especially the South
Granville district straddling Kerrisdale and Oakridge, areas where Manyee
Lui, Lily Lam and others have been busy selling million dollar properties.
25
Another node was in southeast Vancouver in somewhat less expensive neigh-
bourhoods, where there was an active replacement of older houses. Most
striking of all is the ethnoburb of Richmond. New ethnic Chinese immi-
grants accounted for over 10 percent of households in 1996 in all but three
Richmond census tracts; in one tract, next to the large Asia-themed malls, the
level reached almost 35 percent, highest in the metropolitan area.
This same tract is also adjacent to the Vancouver International Airport,
and the overall geographical distribution of new Chinese-Canadians
(Figure 5.6) strongly suggests that the airport is a decisive magnet, with a
decline in immigrant numbers with increasing distance away from this
gateway to and from Canada. Tobler's (1970) first law of spatial analysis
stated that the stronger the relationship between phenomena the closer
they tend to locate to each other. So does the gravitational pull of the air-
port mean that the static map of ethnic segregation conceals a highly mobile
transnational population, with much coming and going by air travel? We
return to this question in Chapter 8.


