Geography Reference
In-Depth Information
AN V
WEST VANCOUVER
N
NORTH VANCOUV
A
NORTH
VANCOUVER
CITY
COQ
M
PORT
M
MO
DY
Y
PORT
COQUITLAM
MAPLE
RIDGE
P TT
MEADOWS
BURNABY
VANCOUVER
N
Airport
RICHMOND
M
N
SURREY
Percentage
tenure = own
LANGLEY
DELTA
A
0 - 68.1
68.2 - 83.3
83.4 - 93.7
93.8 - 98.5
0
0
2
miles
2 kilometers
98.6 - 100.0
WHITE
ROCK
HITE
K
No data
CBD
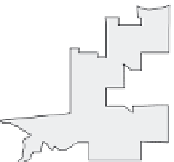
Figure 4.1
Homeownership in 1996 among 1986-96 landings of self-designated ethnic Chinese house-
holds, Vancouver CMA
by housing tenure. Metropolitan Vancouver's average house price of just
over $300,000 in 1996 was by far the highest in Canada, presenting formi-
dable barriers to home purchase. Nonetheless, consistent with public per-
ception, the map of homeownership shows remarkable levels of attainment
by these immigrants (Figure 4.1).
21
With census tracts divided by quintile,
the middle quintile of homeownership for these recent arrivals reached the
astonishing range of 83 to 94 percent. The most expensive districts, with a
mean value in the $700,000-$800,000 range in 1996, included Vancouver's
westside neighbourhoods,
22
the British Properties in the suburb of West
Vancouver, and, just behind in value, the new mansions of the Westwood
Plateau in suburban Coquitlam, all of them popular with wealthy immi-
grants. In these districts the homeownership rate commonly exceeded 90
percent. Here then is the realized stereotype with which we began: asset-
rich millionaire migrants in their substantial homes.
But Figure 4.2, displaying for the same population the percentage of
households below the low-income cut-off (LICO), a poverty threshold,
presents an extraordinary contrast. It reveals a disarmingly contradictory
measure of the miniscule cash flow disclosed to the census enumerators by
exactly the same group of 1986-96 arrivals. With census tracts again parti-
tioned by quintile, the same middle quintile includes tracts where between
48 and 54 percent of these same households declared incomes below the