Environmental Engineering Reference
In-Depth Information
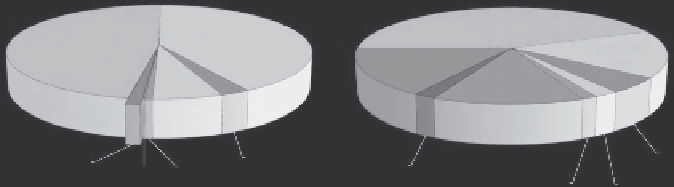
(a)
(b)
EPA-PAH
44.4%
Methyl-PAH
41.4%
EPA-PAH
47.4%
Methyl-PAH
16%
BTEX + TMB
16%
Phenols
14%
O-HET
6.4%
S-HET
5%
S-HET
2.7%
Not known
1.3%
Other
2%
N-HET
0.6%
Phenols and
other 0.2%
N-HET
1%
O-HET
2%
FIGURE 11.4
Analysis of a sample from the contaminated site Zeche Viktoria in Lünen (Germany, well 12Q).
(a) Tar oil (weight %) from the bottom of the well. The mass can be explained by 99% using GC-
MS for all compounds investigated (without BTEX). (b) Groundwater (% mass concentration in
relation to the sum concentration of 16 mg/L).
components present in this specific tar oil that had been in equilibrium with
the surrounding groundwater for decades.
Toluene as a solvent excludes benzene, toluene, ethylbenzenes and xylens
(BTEX) from the analysis by GC-MS and therefore headspace analysis is not
applicable. One can argue that, due to the high water solubility and vapor
pressure, BTEX and phenols are removed by an efficient natural extraction
of the tar oil by the surrounding water. This interpretation is in accordance
with the very low concentrations of phenols found in such samples. In con-
tradiction to the concentrations in tar oils, relatively high concentrations of
BTEX and phenols were found in the corresponding water of well 12Q from
“Zeche Viktoria” (Figure 11.4b).
11.3.2 Adsorption Isotherms on Activated Carbon
Using suitable models, a fit of
q
=
f
(
c
) leads to parameters describing the
adsorption process in a phenomenological approach. Different models are
known [30,31] to describe the relationship between equilibrium concentra-
tion and adsorbed amount of the compound. The Freundlich model
qKc
n
=⋅
(11.3)
is often used in the logarithmic form:
log( )log()
q
=
K
+
n
⋅ log
()
c
(11.4)
However, mixed models are sometimes necessary to describe the depen-
dence of
q
=
f
(
c
), for example, the Langmuir-Freundlich model:
n
Kc
ac
⋅
+⋅
(11.5)
q
=
n
1
Search WWH ::

Custom Search