Agriculture Reference
In-Depth Information
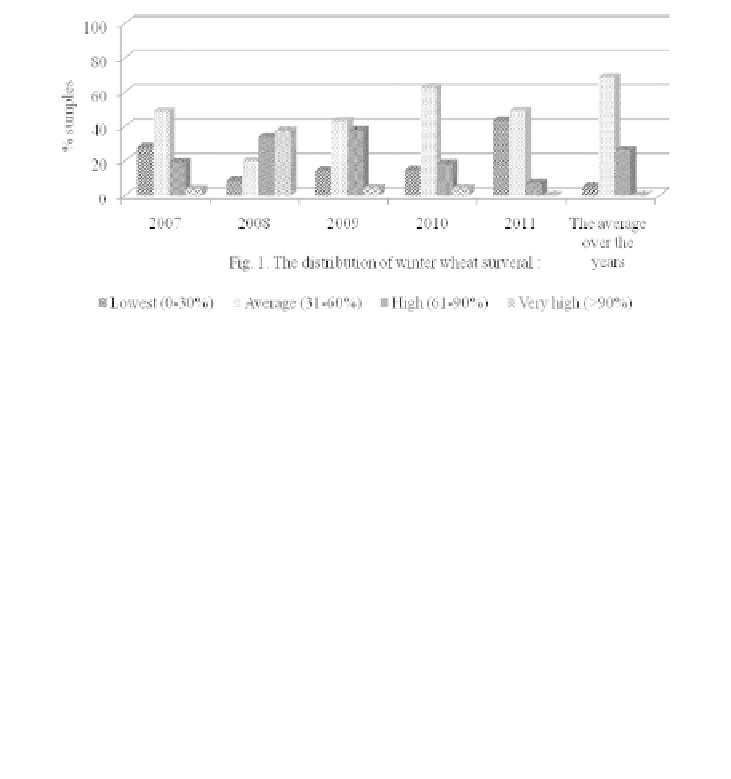
When dividing samples conditionally into four groups according to their probabil-
ity of survival it was found that on average during the years of the study the majority
of samples varied from 31.0 to 60.0 percent. This regularity was observed for 4 years
from 5, excluding 2008, when samples with high and very high values of the character
prevailed (Figure 13.1).
FIGURE 13.1
The distribution of winter wheat survival.
As a result of 5-years' testing samples with the minimum coeffi cient of variation
relatively to others, from 7.0 to 27.0 percent, i.e., with less-expressed reaction to the
changing environmental conditions, were selected from the collection of winter wheat.
In average for the whole period under study 12 samples showed interannually stable
biological stability (above 50%), in four samples this characteristic was stably low.
According to the origin, the samples with relatively stable display of the character
were from the regions of Russian Federation (Saratov, Orenburg, Rostov, Omsk and
Novosibirsk regions, Krasnodar krai, Tatarstan), as well as from foreign countries (the
United States and Ukraine).
Generalization and comparison of experimental data according to the combined
effect of environmental factors showed that the probability of survival is higher in the
samples from different soil and climatic zones of Russia (Table 13.2).
TABLE 13.2
Comparative characteristic of domestic and foreign samples according to the
probability of survival
Domestic
Year of study
x
±
S
x
(cm)
CV
(%)
Min
Max
Span
2007
17,3
100,0
54,7 ± 3,00
32,87
82,7
2008
30,4
100,0
77,3 ± 2,73*
28,70
69,6
2009
11,6
100,0
57,1 ± 3,16
40,69
88,4


Search WWH ::

Custom Search