Environmental Engineering Reference
In-Depth Information
from glass fi ber composites typical of wind turbines. For the bonding of glass fi ber
composites, the analysis is complicated by the development of large-scale bridging,
which requires that the fracture resistance is characterized in terms of the J integral.
For the medium size specimens, the fracture load takes a steady-state value,
F
ss
,
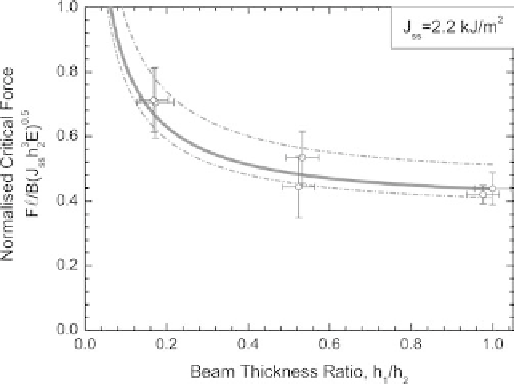
after some crack extension. Figure 22 shows the predicted steady-state fracture
load, calculated from the steady-state fracture resistance data measured using
DCB-UBM specimens as a function of the thickness ratio of the two beams. The
measured steady-state strength values are superimposed as points. It is seen that
there is a good agreement between the model predictions and experimental strength
values of the medium scale specimens. The experimental results confi rm the trends
of the model predictions with respect to the effect of the thickness ratio of the
beams: reducing the thickness of the thin beams leads to a higher fracture load.
Furthermore, the predicted uncertainty of the strength of the medium size speci-
mens (due to the variation in the measured fracture resistance of the DCB-UBM
specimens) is of the same magnitude as found experimentally. Thus, the strength
scaling can be successfully achieved for large-scale bridging problems if the fracture
resistance data are analyzed by the J integral.
7.3.2 Cyclic crack growth of adhesive joints
Building upon the work described in Section 7.3.1 [70], Holmes
et al.
[ 71 ] inves-
tigated the cyclic crack growth behavior of adhesive joints in 1.2 m long medium
size beam specimens subjected to four-point bending. For this specimen confi guration,
a constant load amplitude gives a constant J amplitude,
Δ
J
, even though the crack
Figure 22: The load-carrying capacity of adhesive/glass fi ber composite medium
size specimens predicted using DCB-UBM data (solid line). Dashed
lines are predictions based on upper and lower values of
J
ss
. Experimen-
tal results from tests performed on the medium size specimens subjected to
four-point bending are shown as points; error bars represent the maximum
and minimum values of the measured steady-state force,
F
ss
[ 70 ].
Search WWH ::

Custom Search