Environmental Engineering Reference
In-Depth Information
1600
1400
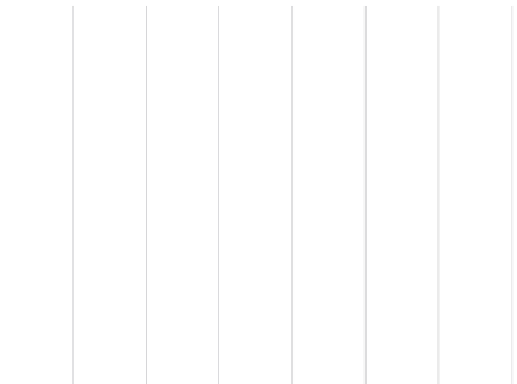
P1m-ave
Pbin
1200
1000
800
600
400
200
0
0
2
4
6
8
10
12
14
16
V (m/s)
Figure 15 : Sample of 1-day fi eld test data at 1-s sampling rate and Bin-averaged
data.
10 Captureability
There are various parameters that should be optimized such as power coeffi cient,
capacity factor, cost of energy, etc.
Parameter “captureability” is a new indicator which shows how much energy
has been captured from the nature in a certain period [3]. Now assume a WT has a
power curve function
P
(
V
) and the wind at the site has probability density function
f
(
V
) vs. wind speed
V
.
Choosing a continuous time period
T
, the following formulas are obtained:
•
Wind power generation
G
during period
T
:
∞
∫
GTPVf VV
=
() ()d
⋅
(21)
0
•
Cumulative wind energy fl ux
E
F
past through the rotor swept area
A
during
period
T
:
∞
∫
F
ETEVf VV
=
() ()d
⋅
(22 )
0
1
2
where
E
(
V
) =
r AV
3
=
r V
3
p
R
2
.
Designed maximum WT generation
G
R
under the assumption that WT has
constantly operated at rated power
P
rated
during the period
T
is given as:
GP T
=
⋅
( 23)
R
rated


Search WWH ::

Custom Search