Environmental Engineering Reference
In-Depth Information
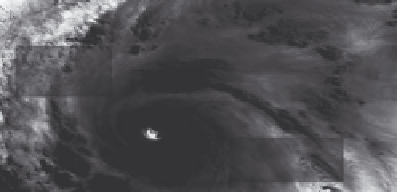
Northern Hemisphere Hurricanes
Eye Speed
Min Wind
Speed
Eye
Max Wind
Speed
Counter-clockwise Wind Structure
Figure 3 : Hurricanes wind speed distribution [ 3 ].
Boxplots of Passing Distance by Passing Hurricane Category
(means are indicated by solid circles)
200
100
0
-100
-200
Passing Hurricane Categry
Figure 4: Probability of hurricanes as function of distance from Western Tip of
Long Island [ 3 ].
Nevertheless, the probability of encountering the sustaining maximum hurri-
cane wind speeds on its eastern side increases as wind power plants move further
offshore, i.e. further east. An internal study at GE showed that although the eastern
tip of Long Island is unlikely to sustain hurricanes above level 2, moving 150 miles
westward increases that probability signifi cantly (Fig. 4). The effect of hurricanes
on the low cycle fatigue and design wind gust speed is not known and represents
one of the risks in developing offshore wind projects in the northeast and mid-
Atlantic U.S. Technologies and methods need to be developed to accurately char-
acterize the impact of hurricanes on the design envelope for both the turbine and
the foundations in the target offshore locations.
4.4.4 Geotechnical conditions
While designing wind power plants, the geotechnical conditions account for most
of the rest of uncertainties encountered other than Hurricane. Engineers normally


Search WWH ::

Custom Search