Environmental Engineering Reference
In-Depth Information
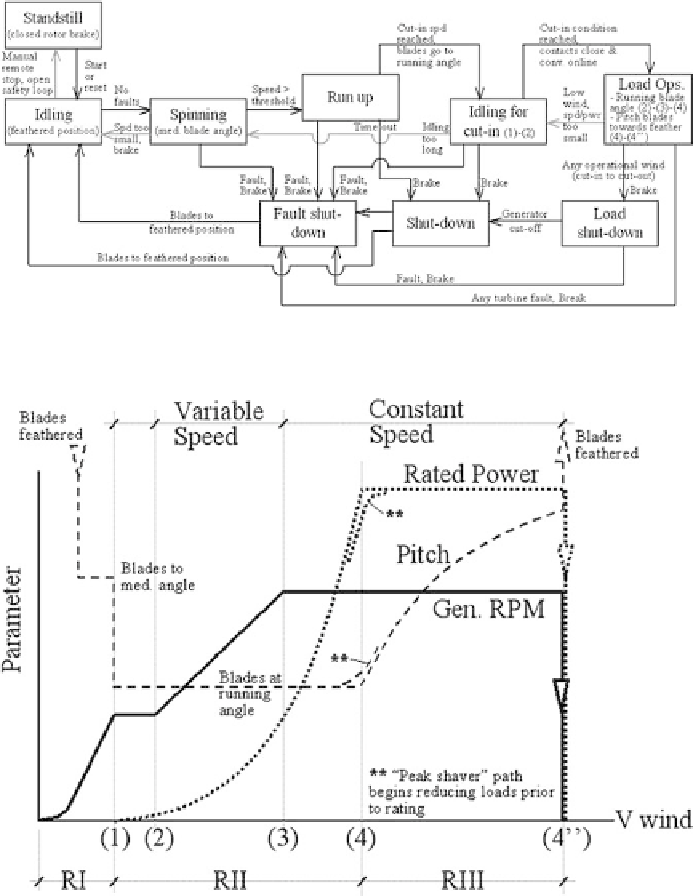
Figure 35: Generalized WT control diagram.
Figure 36 : Power curve and operating characteristics.
As a result of this transition, and with increasing rotor torque, condition (2) is
achieved and the breakers close - bringing the converter online and power
production begins.
Now in region 2 (RII) of the power curve, increasing wind speed will advance
the turbine towards conditions (3) and (4). The blades remain in the full opera-
tional position (fi xed) throughout this period, as the increasing wind speed and
increasing rotor speed (RPM) move together to achieve near optimal angle of
attack at each radial position along the blades.
Search WWH ::

Custom Search