Database Reference
In-Depth Information
Adult
Dutch census
0.4
0.2
0.15
0.3
0.1
0.05
0.2
0
−0.05
0.1
data
remove
global mas.
global sam.
local mas.
local sam.
−0.1
−0.15
0
−0.2
−0.25
−0.1
1
2
3
4
5
6
7
8
9
10 11 12
1
2
3
4
5
6
7
8
9
10
explanatory attribute
explanatory attribute
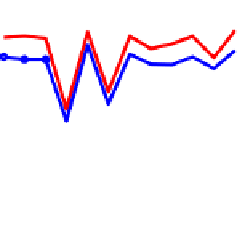
Fig. 8.9
Discrimination with
the local
techniques
The approaches do not perform that well with the Dutch census data, as the sen-
sitive attribute is not very strongly correlated with any other attribute in the dataset.
The local techniques are primarily designed to handle high correlations with the
sensitive attribute that induce
redlining
.
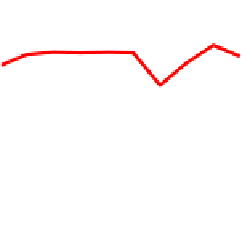
When classifiers become discrimination-free, they may lose some accuracy. Fig-
ure 8.10 presents the resulting accuracies scores of the results of our experiments.
We observe that the local methods lose some accuracy, but work more accurately
than the global methods. Our experiments demonstrate that the local massaging and
the local preferential sampling classify future data with reasonable accuracy and
maintain low discrimination.
Adult
Dutch census
0.9
0.85
remove
global mas.
global sam.
local mas.
local sam.
0.88
0.86
0.8
0.84
0.82
0.8
0.75
1
2
3
4
5
6
7
8
9
10 11 12
1
2
3
4
5
6
7
8
9
10
explanatory attribute
explanatory attribute
Fig. 8.10
Accuracy with
the local
techniques
8.5
Conclusion
In this chapter we discussed the issue of conditional non-discrimination in classifier
design, where different treatment of sensitive groups can be explainable by other
attributes and hence tolerable. We presented a methodology for quantifying the ex-
plainable differences in treatment and the illegal discrimination in data.


Search WWH ::

Custom Search