Environmental Engineering Reference
In-Depth Information
where δ
Y1Y2
is the Pearson correlation between (Y
1
, Y
2
); δ
12
is the Pearson correlation between
(X
1
, X
2
); and
f
(
x
1
,
x
2
; δ
12
) is the bivariate standard normal PDF defined in
Equation 1.37
:
T
−
1
x
x
1
δ
x
x
(
)
(
)
=
1
12
1
1
2
f
xx
,
;
δ
exp.
−
05
2
π
×−
1
δ
(1.109)
1212
δ
1
2
12
2
and μ
Y
i
and σ
Y
i
are the mean and standard deviation of Yi,
i
,
respectively:
∞
∞
∫
(
)
×
()
2
∫
()
×
()
()
−
1
−
1
−
µ
=
F
Φ
x
ϕ
x
d
x
σ
=
F
Φ
x
µ
ϕ
xx
d
(1.110)
Y
i
Y
i
Y
i
i
i
−∞
−
∞
ϕ(
x
) is the univariate standard normal PDF (
Equation 1.3
)
.
ating the CDF transform
F
used. The same approach is followed for evaluating
F
1
−
()
[
],
1
Φ
x
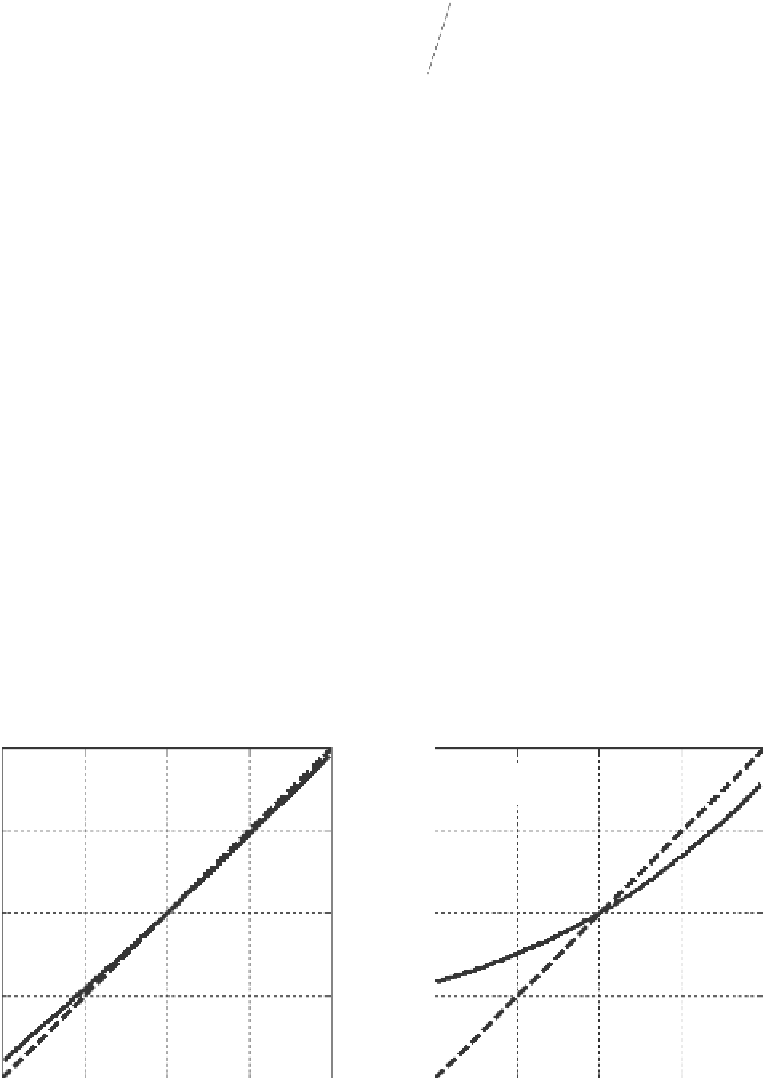
It is clear that δ
Y1Y2
and δ
12
are not identical. Moreover, even though δ
12
spans the full range −1.0-1.0, δ
Y1Y2
only spans
by a factor of 2 (
a
X1
= 1.491/2 = 0.754;
a
X2
= 2.506/2 = 1.253). By doing so, the standard
deviations of (Y
1
, Y
2
) will increase. The resulting relation between δ
Y1Y2
and δ
12
is plotted on
inability of the CDF transform approach to reproduce strong negative correlations among
physical variables is arguably the most critical weakness of this approach.
2
−
()
[
].
2
1.7 real eXaMPle
In this section, the construction of multivariate probability distributions of soil param-
eters will be demonstrated using the Clay/10/7490 database compiled by Ching and Phoon
(a)
1
(b)
1
a
X1
and
a
X2
reduced by factor of 2
0.5
0.5
0
0
-0.5
-0.5
-1
-1
-1
-0.5
0
δ
12
0.5
1
-1
-0.5
0
δ
12
0.5
1
Figure 1.32
Relation between
δ
Y1Y2
and
δ
12
(a) for parameters given in
Table 1.15
; and (b)
a
X1
and
a
X2
reduced
by a factor of 2. The dashed lines are the 1:1 lines.

Search WWH ::

Custom Search