Environmental Engineering Reference
In-Depth Information
1500
1500
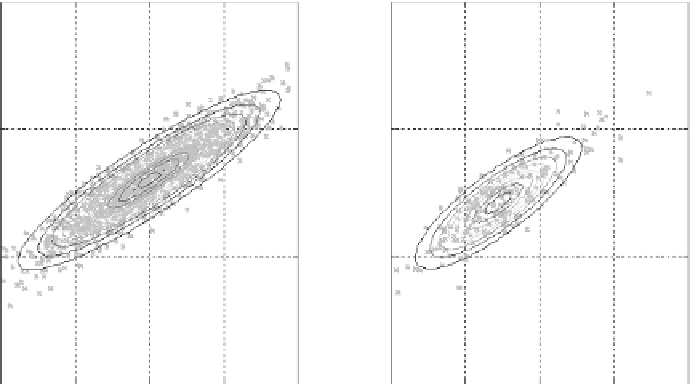
Unconditional bivariate distribution
Conditional bivariate distribution
1000
1000
500
500
100
0
150
200
s
u
(kPa)
250
300
100
150
200
s
u
(kPa)
250
300
Figure 1.18
Contours for the unconditional and conditional bivariate PDF for
(, ).
s
u
′
σ
1.5 non-norMal ranDoM VarIable
1.5.1 non-normal data
Most engineers refer to “non-normal” data as a single column of data (univariate data)
that do not exhibit the classical bell-shaped histogram. We have demonstrated in
Figure
1.5
that even simulated normal data will not produce a bell shape when the sample size is
small. Hence, one should not be hasty to conclude that a column of data is not normally
distributed based on visual inspection of the histogram alone. We have emphasized that
the normal distribution is very useful, because it can be fitted by two simple parameters
(mean and standard deviation) and it can be extended to a multivariate distribution with
reasonable data requirement in the form of a correlation matrix. In view of its practicality
and analytical tractability, one should abandon only the normal assumption in the presence
of strong evidence.
There are two different sources of evidence that may compel one to reject the nor-
mal hypothesis. One is statistical evidence based on goodness-of-fit test as discussed in
Section 1.2.3. We note in passing that goodness-of-fit tests are applied to the entire data
set. In actuality, we are more interested in deviations from normality at the probability
tails. The reason is that it is below average strength that will lead to failure. The typical
acceptable probability of failure of civil engineering infrastructures is one in a thou-
sand. If strength is the only random variable governing the probability of failure, then
we are interested only in values that are approximately three standard deviations below
the mean strength. We do not discuss this nonnormality in the probability tails below,
because it is usually difficult to gather sufficient data to characterize this tail behavior
with sufficient confidence.
The second reason for rejecting normality is violation of physics. A normal random vari-
able is unbounded, that is, it can take all values on the real line. A soil parameter such as
the undrained shear strength (
s
u
) can only take positive values. The OCR is larger than 1
by definition. The ratio between the interface friction angle and the soil friction angle is
Search WWH ::

Custom Search