Environmental Engineering Reference
In-Depth Information
35%
30%
25%
20%
15%
10%
5%
0%
A: Subarea with
small fraction
B: Subarea with
medium fraction
D: Subarea with no
data on fraction
0
20
40
Number of samples
60
80
100
Figure 13.42
Value of information versus number of additional soil samples for different subareas of oil
refinery.
this value of information assessment are shown in
Figure 13.42;
the value of information
is expressed as a percentage of the cost to remediate the subarea. For a subarea where it
was likely that there is benzene contamination, the value of information from additional
soil samples was relatively small because it is unlikely that the additional information will
change the decision to remediate the subarea. On the other hand, the value of information
was relatively high for subareas where there was the greatest potential to change the prior
decision to remediate (i.e., those subareas in
Figure 13.40
with prior probabilities near 66%
that the contaminated fraction was <1/20).
13.5.3 exploration program for resources
The development of unconventional oil and gas resources is an interesting application
because the technologies are in their infancy and there is little “prior” information that is
necessarily relevant to a new field.
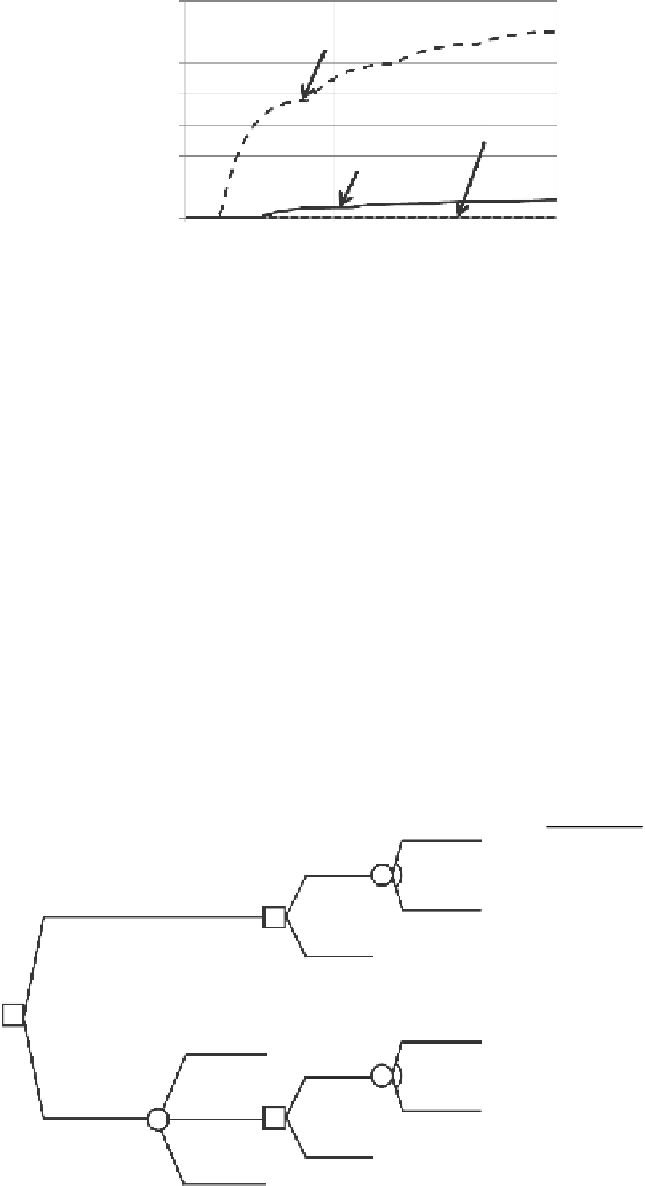
Figure 13.43
shows a preposterior decision tree to assess
the value of information from test wells in a new play. The consequence is related to the fre-
quency of good wells in the new play, θ. If the frequency is greater than a breakeven value,
Consequence
q
: Frequency
of good
wells
Invest
P
(q)
Cost × (q/q*-1)
R
Do not drill any test well
not
Invest
X
: Number of good
test wells
X
= 0
Invest
q: Frequency
of good
wells
P
(q|
x
)
Cost × (q/q*-1)
Drill n test
wells
X
=
x
not
Invest
X
=
n
Figure 13.43
Preposterior decistion tree to assess value of information in drilling test wells for an uncon-
ventional gas reservoir.
Search WWH ::

Custom Search