Environmental Engineering Reference
In-Depth Information
0.045
0.040
0.035
0.030
0.025
0.020
0.015
0.010
Updated:
x = 40
kPa
, n = 10
Updated:
x = 50
kPa
, n = 10
μ′′
T
X
= 50.0 kPa
σ′′
T
X
= 10.4 kPa
μ′′
T
X
= 41.5 kPa
σ′′
T
X
= 10.4 kPa
Prior:
μ′
T
X
= 50 kPa
σ′
T
X
= 12.5 kPa
0.005
0.000
0
20
40
60
80
100
x
(kPa)
100,000
90,000
80,000
70,000
60,000
50,000
40,000
30,000
20,000
Prior
Updated:
x = 40
kPa
, n = 10
x
*
Opt
= 18.0 kPa
E
(
C
)
Min
= $14,002
Updated:
x = 50
kPa
, n = 10
x
*
Opt
= 26.5 kPa
E
(
C
)
Min
= $10,606
10,000
0
0
20 40 60
Design undrained strength,
x
* (kPa)
80
100
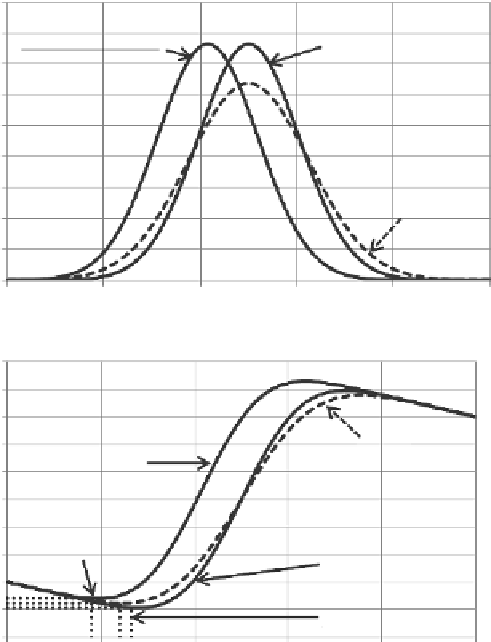
Figure 13.25
Updated results for two different results from testing of compacted fill.
strength,
x
*, a
n
d the expected total cost in two ways. First, the mean value for
X
will be
updated from
x
. Second, the total standard deviation for
X
will be reduced with the magni-
tude of the reduction increasing with increasing
n
.
*
The optimal design value in a posterior analysis is shown in
Figure 13.25
for two dif-
ferent possible QA/QC test results. Note that the updated optimal design value incre
a
ses
and the expected cost decreases from the prior analysis if the measured sample mean,
x
, is
equal to the prior mean of 1000 psf. This result occurs because we have reduced uncertainty
in
X
by obtaining 10 measurements, meaning that a less-conservative design is possible.
Conversely, the updated optimal design value decreases and the expected cost increases
from the prior analysis if the measured sample mean is 200 psf lower than the prior mean
(800 vs. 1000 psf). In this case, while we are more certain about
X
, the updated mean value
for
X
is lower; so, a more conservative and costly design is required.
*
Note that this result where the uncertainty in the updated distribution for the model parameter always decreases
with added information is not general; the uncertainty in the updated distribution for a parameter can increase
with added information (e.g.,
Figure 13.10
).


Search WWH ::

Custom Search