Environmental Engineering Reference
In-Depth Information
100%
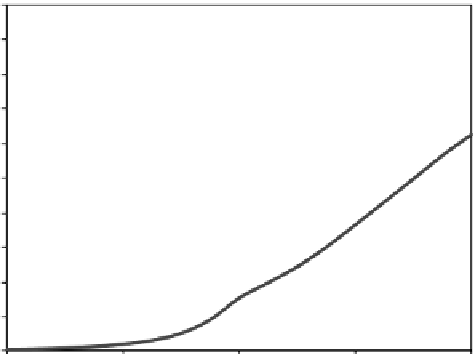
Average curve: 10,000 simulations
Average curve: 100 simulations
90%
80%
70%
60%
50%
40%
30%
20%
10%
0%
12
14
16
18
20
Water level in the reservoir (m)
Figure 11.20
The impact of number of simulations when using Monte Carlo on fragility analysis.
100%
Occurence
probability of
L
i
:
p
Oi
=
P
Li
-
P
Ui
P
Li
P
Ui
0%
N
i
= 1
L
Li
L
i
L
Ui
Loads
APF =
p
Oi
·
P
Ci
100%
p
Ci
0%
L
i
Loads
Figure 11.21
The estimation of annualized probability of failure (APF) using fragility curves.


Search WWH ::

Custom Search