Environmental Engineering Reference
In-Depth Information
100.0%
Average curve
Crest level
M.O.L.
80.0%
60.0%
40.0%
20.0%
0.0%
12
13
14
15
16
17
18
19
20
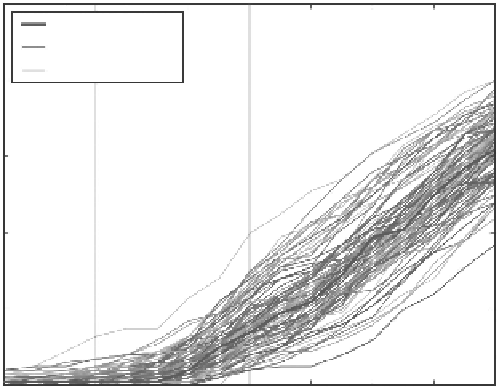
Maximum water level in the reservoir (m)
Figure 11.19
The impact of reducing epistemic uncertainty on fragility analysis.
Moreover, accepting the fact that typically natural uncertainty cannot be reduced but
epistemic can be narrowed by acquiring better knowledge (i.e., by means of improved
geotechnical surveillance), the new set of fragility curves shown in
Figure 11.19
has been
obtained to assess the impact of reducing epistemic uncertainty to 1° for the friction angle
standard deviation and 0.5 kPa for the cohesion standard deviation.
As shown in
Figure 11.19
,
although the “average” fragility curve remains the same, the
range of variation of the complete family of fragility curves has been significantly narrowed.
The importance of this relies on the fact that, in principle, epistemic uncertainty can be
reduced by investigations (boreholes, instrumentation records, performance evaluation, etc.).
Among the many other remaining issues, given that all the decisions taken in Step 1
through Step 7 could be critically analyzed by engineering judgment and sensitivity analysis,
the optimal number of simulations to use when performing a Monte Carlo analysis is dis-
cussed.
Figure 11.20
represents the comparison between “average” fragility curves obtained
by 100 samples versus 10,000 samples.
Despite the similarity between the two curves in
Figure 11.20
,
their differences can have
important implications on the annual probability estimation. Significantly, with a low num-
ber of simulations (e.g., 100 or even 10,000), a single pair of sampled values resulting in
failure, particularly for lower pool levels, can have a dramatic impact on the overall risk
estimation, as discussed below.
11.5 FroM FragIlItY CurVeS to annualIzeD ProbabIlItY
oF FaIlure CoMMonlY uSeD In rISk analYSIS
As shown and discussed in Section 11.2.2 through an example of a risk analysis for an earth
dam, if results are to be provided in terms of annualized risk (which is the current state of
practice in dam engineering), fragility curves should be combined with the probability of the
loads that may produce the failure (
Figure 11.21
)
, which are usually characterized by their
AEP (in the examples of this chapter, such load/driver of the failure is the water pool level).
Search WWH ::

Custom Search