Environmental Engineering Reference
In-Depth Information
natural uncertainty is usually related to the occurrence of events that can produce the struc-
tural failure and the randomness of the structure's resistant behavior for the load produced
by the events. In contrast, epistemic uncertainty is mainly focused on the lack of knowledge
of the failure mechanisms, the structure's resistance parameters, and the consequences pro-
duced by the failure.
In any case, uncertainty characterization is an inherent process in any risk analysis,
since it encompasses the failure probability concept. If there were no uncertainties, the
load situation that produces the structural failure with 100% probability could be precisely
determined.
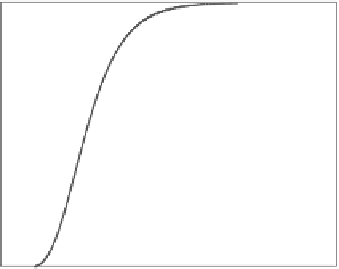
11.3.2 Concept of fragility curves
Fragility curves represent a relationship between failure probability and the magnitude of
the loads that produce the failure. Different empirical and analytical methodologies have
been developed to obtain this kind of curves in complex structures (Altarejos-García et al.,
2012; EPRI, 1994; Shinozuka et al., 2000). Fragility curves are useful in risk analysis of
complex structures, since they facilitate the evaluation of the structural response for differ-
ent load values.
In general, a single fragility curve is used to represent the natural uncertainty of the
system response. For each loading state, this curve represents the probability of structural
failure produced by the natural randomness in the structure and the terrain. In this chapter,
the standard deviation of this single curve is represented with β
R
.
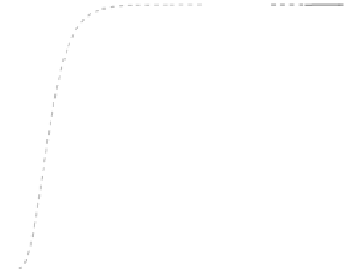
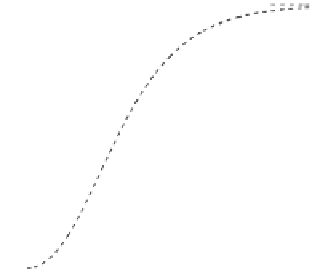
In order to characterize the epistemic uncertainty, a probabilistic distribution is usu-
ally defined for the median of the previously defined fragility curve, which can also be
called “average” fragility curve. The standard deviation of this probability distribution is
represented with β
U
. Variations in the fragility curve average produce a family of fragility
curves that characterize both uncertainties, as shown in
Figure 11.9
.
As can be observed,
the median of the distribution for both uncertainties is normally assumed to be the same
(EPRI, 1994).
In general, for a defined loading state, a complex structure can fail due to different failure
modes, controlled by failure mechanisms. Commonly, fragility curves are defined for each
failure mechanism separately and later combined within the framework of risk calculation
by means of different techniques (i.e., common cause adjustment, SPANCOLD 2012).
100%
5%
50%
95%
b
U
b
R
0%
Loads
Figure 11.9
An example of the family of fragility curves. (Adapted from EPRI. 1994.
Methodology for Developing
Seismic Fragilities
. Electric Power Research Institute.)


Search WWH ::

Custom Search