Environmental Engineering Reference
In-Depth Information
lives/year. This indicates justification for consideration of potential interim risk reduction
measures. The computed ALL and APF estimates for conditions after the proposed reme-
dial measures correspond to a risk level with “diminishing justification to take action to
reduce risk” based on Reclamation's Public Protection Guidelines since ALL is estimated
to be less than 0.01 (1 × 10
−2
) lives/year and APF is estimated to be less than 1 × 10
−4
per year.
In summary, these computed ALL and APF estimates indicate that the remedial mea-
sures proposed for the earth dam are justified based on Reclamation's Public Protection
Guidelines and that remedial measures should be considered.
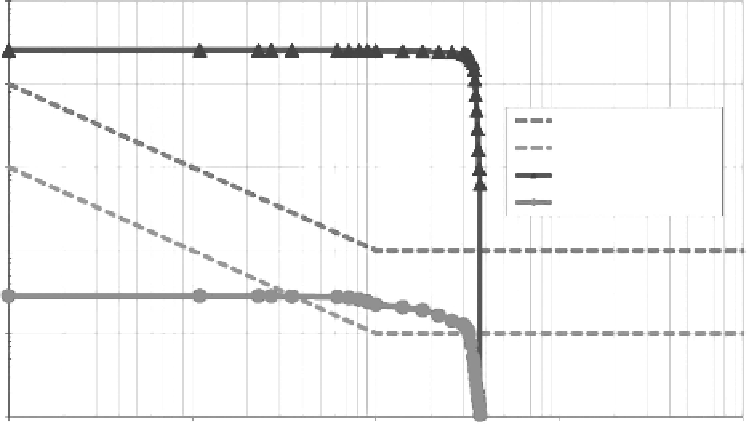
Rather than using a single “average” ALL estimate,
Figure 11.8
presents the entire esti-
mated probability distribution of life loss for earth dam for failure from internal erosion/soil
transport, before and after the proposed rehabilitation. It follows the F-N chart format used
by ANCOLD (2003), in which F(i)
(i)
is plotted against N(i),
(i)
, where F
(i)
= ∑
i
f
(i)
, and f
(i)
are ranked
in descending order of the magnitude of life loss, N
(i)
for all n peak pool elevation intervals
and (i) denotes the rank order [i.e., (i) = (1), (n)]. The resulting plot portrays a cumulative
probability distribution in which “the probability-consequence (f, N) pairs are ordered in
descending order of magnitude of N, and f is cumulated from largest to smallest to calcu-
late the annual exceedance frequency. The mean of N is the area under the cumulative FN
curve” (Bowles, 2007).
Figure 11.8
also shows the ANCOLD (2003) Societal Tolerable Risk Guidelines.
Figure
11.8
best summarizes the impact of the proposed remedial measures of earth dam on the
potential loss of life from a dam failure. While the life-loss risk before the rehabilitation
falls above the limit of tolerability for existing dams, after the proposed remedial mea-
sures the life-loss risk decreases to values below the limit of tolerability for existing dams.
Although not applicable to this earth dam,
Figure 11.8
also shows the more stringent limit
1.E-02
1.E-03
ANCOLD existing dams
ANCOLD new dams
Earth dam existing
1.E-04
Earth dam rehabilitated
1.E-05
New dams and major augmentations
1.E-06
(not applicable to example dam)
1.E-07
1
10
100
1000
10000
N, number of fatalities due to dam failure
Figure 11.8
F-N chart for existing and rehabilitated earth dam, including ANCOLD (2003) societal risk
guidelines for dams.
Search WWH ::

Custom Search