Environmental Engineering Reference
In-Depth Information
(a)
50
FS
1
=
30
(b)
50
Reliability index β
=
R
/
r
β-ellipse
45
40
35
30
25
45
40
FS
1
=
20
FS
2
=
1.60
FS
2
=
1.48
FS
2
=
1.30
FS
2
=
1.15
1-σ dispersion
ellipse
r
35
30
25
R
FS
1
=
10
20
15
10
5
0
20
15
10
5
0
Design point (28.0, 28.3),
the most probable failure
point
0
10
20
30
40
0
10
20
30
40
α(°)
α(°)
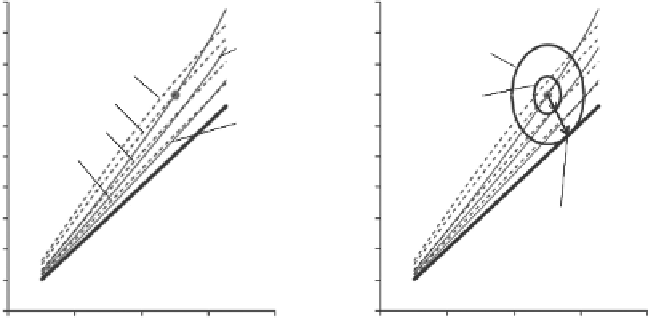
Figure 9.15
(a) Contours of
FS
1
and
FS
2
and the mean-value point where
FS
1
=
30.1 and
FS
2
=
1.48; (b) dis-
persion ellipses in the space of
α
and
ϕ
. The plots are for i
=
0,
k
s
/
k
n
=
0.1, p
=
1 MPa,
K
0
=
1.5,
R
=
2 m,
h/R
=
0.85, and
γ
=
0.027 MN/m
3
.
clearly shows that the mean
FS
1
is only as safe as the mean
FS
2
, despite its being 20 times
higher than
FS
2
, because the same (α, ϕ) point for both is at the same distance from the LSS
(where
FS
1
=
FS
2
= 1), which separates the safe combinations (FS > 1.0) of values of (α, ϕ)
from the unsafe combinations (
FS
< 1.0) of (α, ϕ).
This problematic aspect of using safety factors can be avoided if one uses the reliability
index, as shown in
Figure 9.15b.
The FORM computes a reliability index, β, which is the
distance from the safe mean-value point (α, ϕ) = (25°, 35°) to the most probable failure point
(α = 28.01°, ϕ = 28.33°), also called the design point, in units of directional standard devia-
tions. The same β value is computed regardless of whether
FS
1
or
FS
2
is used to define the
LSS FS = 1.0.
Figure 9.16a
shows the results of SORM reliability analysis on the foundation of FORM
results. The FORM results were obtained automatically using the practical constrained
optimization approach of Low and Tang (2007). The SORM procedure in the spreadsheet
was described in Chan and Low (2012a). The parameters α, ϕ,
k
s
/
k
n
,
p
, and
K
0
(defined in
connection with
Equation 9.9)
are assumed to be normally distributed random variables,
with mean values μ and standard deviations σ as shown in the labeled columns. Other input
values (with zero standard deviations) are
i
= 0,
R
= 2.0 m,
h/R
= 0.85, and γ = 0.027 MN/
m
3
. The mean ratio of normal force N to wedge weight W is 71 for this case. The mean
FS
1
= 30.1, and mean
FS
2
= 1.48, with α = 25°, ϕ = 35°,
k
s
/k
n
= 0.1,
p
= 1 MPa, and
K
0
= 1.5.
Hence, at these mean input values, the wedge is safe. However, wedge failure will occur
when the mean values descend/ascend to the design point values shown in the
x
* column
in
Figure 9.16a,
analogous to
Figure 9.1
but in five-dimensional (5D) space. The design
point values are α* = 28.01°, ϕ* = 28.34°, (
k
s
/k
n
)* = 0.1,
p
* = 0.9975 MPa, and
K
0
* = 1.474.
The wedge is on the verge of failure at these design values, mainly due to a greater semi-
apical angle (α* = 28.01° > mean α value of 25°) and a lower friction angle of the joints
(ϕ* = 28.34° is smaller than the mean ϕ value of 35°). The distance from the safe mean-value
point to this most probable failure combination of parametric values, in units of directional
standard deviations, is the reliability index β, equal to 2.684 in this case.
The
n
in
Equation 9.3
are the dimensionless equivalent standard normal random variables
under the square root sign of
Equation 9.2,
and their values in
Figure 9.16a
suggest that ϕ and
Search WWH ::

Custom Search