Environmental Engineering Reference
In-Depth Information
Figure 9.12c
shows the curves of reliability index β = 3 as a function of the thickness
t
and external diameter
d
of the tubular pile, for the deflection performance criterion and
pile-bending failure mode. The configuration at location
a
(i.e., 32 mm annular wall thick-
ness and external diameter 1.42 m) yields a reliability index of 3 with respect to both the
deflection and the bending moment modes. Configurations along line
ac
will have a reli-
ability index of 3 for the bending moment mode, and >3 for the deflection mode, whereas
configurations along line
ab
mean a reliability index of 3 for the deflection mode, and >3 for
the bending moment mode.
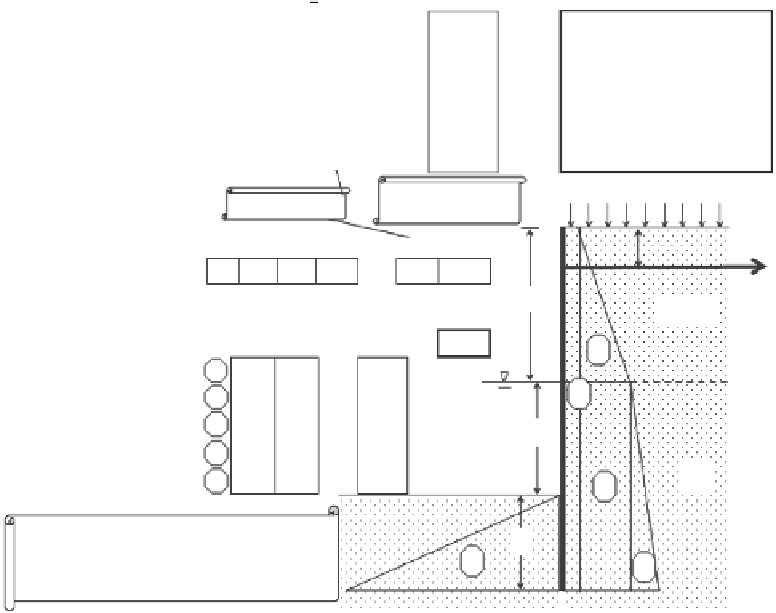
9.8 ForM DeSIgn oF an anChoreD Sheet PIle Wall
The Microsoft Excel constrained optimization approach for RBD of the anchored sheet
pile wall in
Figure 9.13
was presented in Low (2006). Another example was presented in
Low (2005). Given the uncertainties and correlation structure in
Figure 9.13
,
one wishes
to find the required total wall height
H
so as to achieve a reliability index of 3.0 against
rotational failure about point “
A.
” The solution (
Figure 9.13
)
indicates that a total height
of 12.15 m would give a reliability index β of 3.0 against rotational failure. With this wall
height, the mean-value point is safe against rotational failure, but failure occurs when the
mean values descend/ascend to the values indicated under the
x
* column. These
x
* values
crmatrix (Correlation matrix)
x*
Mean StDev
nx
γ
γ
sat
q
s
ϕ′
δ
z
γ
γ
sat
γ
Normal
Normal
Normal
16.204
18.443
10.276
17
20
10
0.85
1
2
-0.93632
-1.55725
0.13807
1
0.5
0
0.5
0
0
γ
sat
0.5
1
0
0.5
0
0
00
1
0
0
0
q
s
q
s
Normal
Normal
33.514
17.292
38
19
2
1
-2.24307
-1.70765
0.5
0.5
0
1
0.8
0
ϕ′
ϕ′
δ
z
δ
00
0
0.8
1
0
z
Normal
2.9632
2.4
0.3
1.87735
00
0
0
0
1
Surcharge
q
s
Boxed cells contain
equations
d
∗
= H - 6.4 - z
∗
d
∗
1.5 m
T
K
a
K
ah
K
p
K
ph
H
PerFn
A
0.3
0.249 5.904 5.637 12.15 2.79
0.00
6.4 m
γ, ϕ′, δ
Forces Lever arm Moments
(kN/m)
β
3.00
(m)
(kN-m/m)
2
Water table
1 -31.1 4.575
2 -82.8 2.767
3 -149 7.775
4 -35.6 8.733
5189.2 9.72
-142
-229
-1156
-311
1839
1
z
γ
sat
Dredge level
3
For a given H, the embedment depth
d
is random due to random
z
which
implies uncertain dredge level
d
5
4
Figure 9.13
Design total wall height for a reliability index of 3.0 against rotational failure. Dredge level and
hence
z
and
d
are random variables.


Search WWH ::

Custom Search