Environmental Engineering Reference
In-Depth Information
300
n
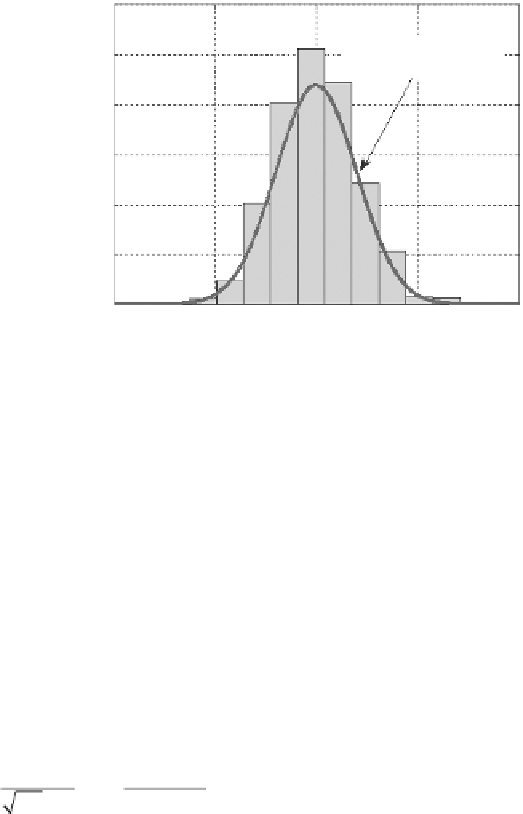
= 1000
Normal PDF
with μ = 100 and σ = 20
250
200
150
100
50
0
0
50
100
y
150
200
Figure 1.3
Histogram of Y. The solid line is the normal PDF with
μ
=
100 kPa and
σ
=
20 kPa.
1.2.3 provides a more robust method of assessing goodness of fit to a normal distribution,
although it is less visually appealing.
1.2.2.2 Cumulative distribution function
The cumulative distribution function (CDF) of Y is defined as the probability that a ran-
dom variable Y is less than or equal to a specific numerical value
y
. In this chapter, an
uppercase symbol denotes a random variable and a lowercase symbol denotes an ordinary
variable (it is helpful to imagine this ordinary variable taking a specific constant number,
say 100 kPa). This distinction is critical. Symbolically, the CDF is denoted by F(
y
). Basically,
F(
y
) is the integral of the PDF (or PDF is the derivative of CDF). For the normal distribution,
its CDF is
y
1
−−
⋅
(
t
µ
σ
)
2
⋅
∫
(1.5)
F
()
y
=
exp
dt
2
2
2
πσ
⋅
−∞
(a)
700
(b)
40
35
600
30
500
25
400
20
300
15
200
10
100
5
0
0
0
50
100
y
150
200
0
50
100
y
150
200
Five bins
100 bins
Figure 1.4
Histograms of Y with two different number of bins.

Search WWH ::

Custom Search