Environmental Engineering Reference
In-Depth Information
-
m
-
R
m
m
Q
m
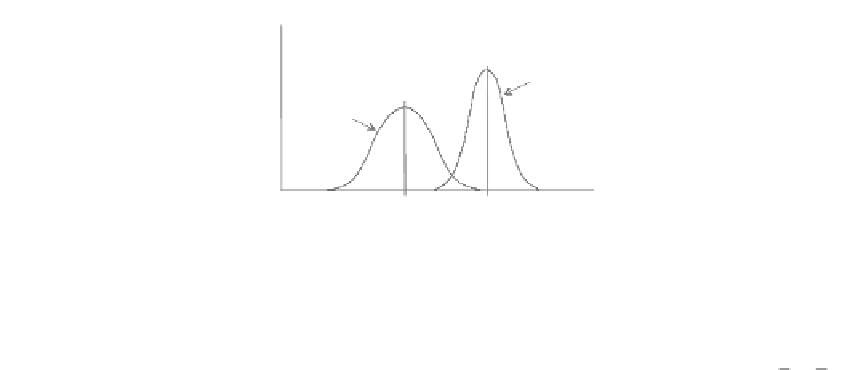
Measured load and resistance values
Figure 8.1
Frequency distributions for measured load and resistance values.
Here g is a random variable representing the margin of safety and R
m
and Q
m
are random
uncorrelated measured (actual) resistance and load values, respectively. Idealized distribu-
allowa
bl
e stres
s
design (ASD) could be computed from these two data sets as FR/
= Q
m
,
where R
m
and Q
m
are the mean values of the two distributions. The limitations of the factor
of safety approach are well known and are not repeated here.
Most often, nominal (predicted) values of resistance and load used in limit state design
equations can be expected to vary from measured values for soil-structure limit states. The
ratio of measured to nominal (predicted) value is called “bias.” In this chapter, bias values are
denoted as X. In the context of geotechnical soil-structure design, the magnitude of bias values
will depend on model accuracy (the intrinsic accuracy of the deterministic theoretical, semi-
empirical, or empirical model representing the mechanics of the limit state under investigation),
random variation in input parameter values, spatial variation in input values, quality of data
and, consistency in interpretation of data when data are gathered from multiple sources, which
is the typical case (Allen et al. 2005). Bias values and bias statistics can be used to transform
nominal (predicted) values to measured values so that estimates of actual probability of failure
are realistic. Resistance bias (X
R
) and load bias (X
Q
) are random variables and are computed as
X
R
= R
m
/R
n
(8.4a)
X
Q
= Q
m
/Q
n
(8.4b)
Here, R
n
and Q
n
are nominal (predicted) resistance and load values, respectively. These
transformations are only valid if the bias values are uncorrelated with predicted values.
Substitution into
Equation 8.3
gives
g = X
R
R
n
− X
Q
Q
n
(8.5)
Equations 8.3
and
8.5
with g = 0 are of particular interest since these equations delineate
between safe and unsafe outcomes (i.e., the failure line). The minimum value of R
n
to satisfy
Equation 8.2
is
γ
Q
Qn
R
=
(8.6)
n
ϕ
Substituting into
Equation 8.5
gives
γ
Q
Qn
(8.7)
gX
=
−
XQ
R
ϕ
Qn
Search WWH ::

Custom Search