Environmental Engineering Reference
In-Depth Information
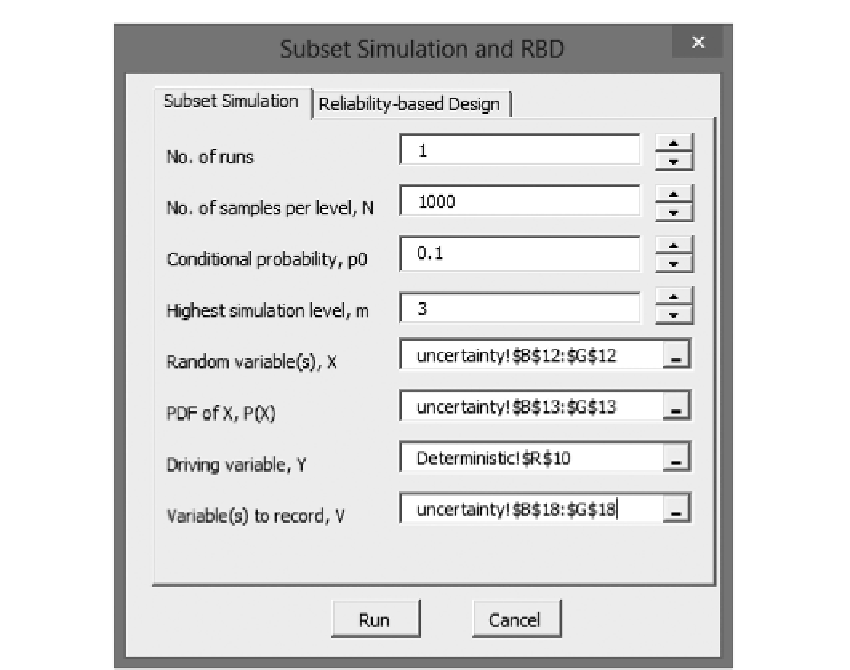
Figure 7.12
Subset Simulation userform for the James Bay Dike example.
7.7.1 Subset Simulation results
Among the 3700 samples from Subset Simulation, 1134 samples are identified as failure
samples (i.e.,
FS
< 1 or
Y
> 1). These 1134 failure samples include 1000 samples in simula-
tion level '3' (i.e., all samples in simulation level '3' fail) and 134 samples in simulation level
'2'. As summarized in
Table 7.7
,
Equation 7.18
is used to estimate the failure probability.
Since
p
0
is taken as 0.1 in Subset Simulation,
P
(
L
i
) is 0.9, 0.09, 0.009, and 0.001 for simu-
lation levels '0', '1', '2', and '3', respectively. Since no failure sample occurs in simulation
levels '0' and '1', the
P
(
F
|
L
i
) values at these two simulation levels are 0. On the other hand,
all samples fail in simulation level '3', leading to
P
(
F
|
L
i
) = 1000/1000 = 1 at the simula-
tion level '3'. The
P
(
F
|
L
i
) at simulation level '2' is 134/900. As shown in the last column of
Table 7.7
,
the failure probability is calculated as 0.234%.
Figure 7.13
shows a CCDF for
Table 7.7
Failure probability of th
e James Bay Dike design example
Simulation
level i
P(L
i
)
P(F|L
i
)
P(F)
0
0.9
0/900
0.9
×
0/900
+
0.09
×
0/900
+
0.009
×
134/900
+
0.001
×
1000/1000
=
0.234%
1
0.09
0/900
2
0.009
134/900
3
0.001
1000/1000


Search WWH ::

Custom Search