Environmental Engineering Reference
In-Depth Information
Cell C14, respectively. The smaller one among
FS
uls
and
FS
sls
is used to calculate the driving
variable
BD
/
FS
min
in Cell B18.
7.6.2 uncertainty model worksheet
To enable a consistent comparison with the designs by Phoon et al. (1995) and Wang et al.
(2011a), the uncertainty modeling in this section follows those adopted in their studies.
Since only the uncertainty on ϕ′ is considered explicitly in their study, this section only
models the ϕ′ as a random variable that is lognormally distributed with a mean = 32° and
COV = 7% (between 5 and 10%). In addition, since the design parameters (i.e.,
B
and
D
) of
the drilled shaft are artificially treated as uniformly distributed variables in the expanded
RBD approach, their random samples are generated in the uncertainty model worksheet. In
this study, three possible
B
values of 0.9, 1.2, and 1.5 m (i.e.,
n
B
= 3) are considered, and the
possible
D
values vary from 2.0 to 8.0 m with an increment of 0.2 m (i.e.,
n
D
= 31), which
are consistent with those adopted by Wang et al. (2011a).
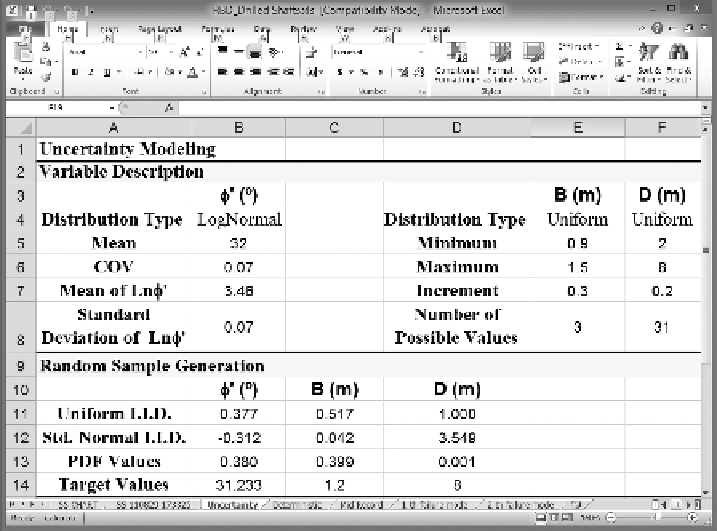
Figure 7.7
shows the uncertainty model worksheet, which consists of two parts: a variable
description zone from Rows 2 to 8 and a random sample generation zone starting from Row
9. The variable description zone is used to define the variables ϕ′,
B
, and
D
. Their distribu-
tion types (Cells B4, E4, and F4) and statistics (i.e., mean (Cell B5) and COV (Cell B6)) of ϕ′,
and the minimum values (Cells E5 and F5), maximum values (Cells E6 and F6), and numbers
(Cells E8 and F8) of possible values of
B
and
D
are defined in the description zone. Using the
information of variables ϕ′,
B
, and
D
, their random samples are generated in the second zone
(Rows 9-14) of the uncertainty model worksheet. The generation of random samples starts
with generating uniform random samples using an Excel built-in function “RAND().” In
this study, “RAND()” is implemented in Cells B11-D11 to generate three random samples
Figure 7.7
Uncertainty model worksheet for the drilled shaft design example.
Search WWH ::

Custom Search