Environmental Engineering Reference
In-Depth Information
(a)
1.25
1.15
Y
= 14.73
1.05
0.95
0.85
m
= 0
0.75
0.85
0.95
1.05
1.15
X
1
Level 0
(b)
1.24
m
= 1
1.22
Y
= 16.69
MCMC
1.20
1.18
Y
= 15
1.16
Y
= 14.73
1.14
m
= 0
1.12
0.90
0.95
1.00
1.05
1.10
X
1
Level 1
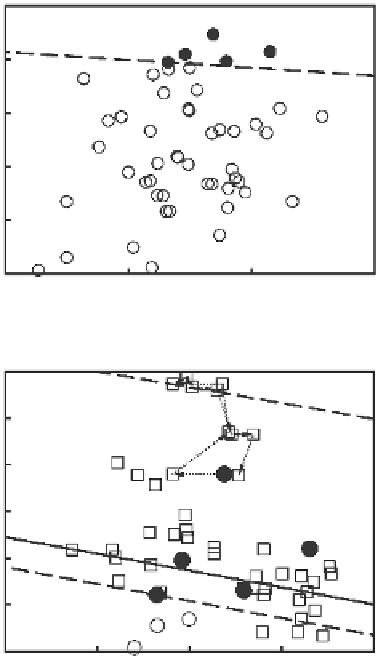
Figure 7.1
Illustration of Subset Simulation procedure.
3. Sort 50
Y
values in an ascending order and determine the 45th largest value (i.e., 14.73,
as shown in
Figure 7.1a
by the dashed line) among the 50
Y
values, which is taken as
y
1,
that is,
y
1
= 14.73;
4. Determine five seed samples of (
X
1
,
X
2
) with
Y
values greater than
y
1
(i.e., 14.73),
which are highlighted in
Figure 7.1a
by solid circles;
5. Start with each seed sample to generate a Markov chain consisting of 10 conditional
samples for
Y
>
y
1
using MCMC. The seed samples are then discarded. For example,
Figure 7.1b
shows the transition between the current sample to the next sample on
a Markov chain by arrows. A Markov chain is generated for each seed sample. As a
squares;
6. Sort the 50
Y
values for the 50 conditional samples with
Y
>
y
1
in an ascending order
and determine the 45th largest value among the 50
Y
values, that is, 16.69 in this
example (see
Figure 7.1b
),
which is greater than 15. The target failure domain is hence
achieved, and the simulation is stopped.
Since five seed samples used to generate conditional samples in the next simulation
level (i.e.,
m
= 1) are discarded, 45 MCS samples are obtained for
m
= 0. In addition, 50
Search WWH ::

Custom Search