Environmental Engineering Reference
In-Depth Information
Prior joint PDF
4
3.5
3
2.5
μ
K
2
1.5
1
0.5
20
25
30
35
40
45
50
55
μ
φ
(°)
Posterior joint PDF
4
3.5
3
2.5
μ
K
2
1.5
1
0.5
20
25
30
35
40
45
50
55
μ
φ
(°)
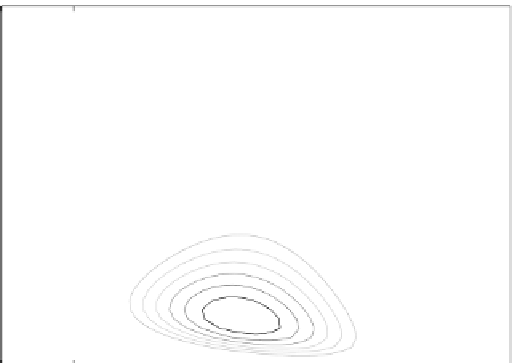
Figure 5.12
Contour plots of the prior and posterior joint PDF of
μ
φ
and
μ
K
given CPT measurement
outcomes.
random variables γ, μ
K
, and μ
φ
that characterize the soil material. The likelihood function of
this information can be expressed as follows:
L
(,
γµ µ
,
) ((,
=
I h
γ µµ
,
)
≤ 0
),
(5.55)
K
ϕ
K
ϕ
where
I
is the indicator function and
h
(γ, μ
K
, μ
φ
) is an LSF describing the information and
is given by
h
(,
γµ µ
,
)
=
kVQ
2
−
(,
γ µµ
,
.
(5.56)
K
ϕ
m
u
K
ϕ


Search WWH ::

Custom Search