Environmental Engineering Reference
In-Depth Information
than CL clay, that the backfill might be less compacted or better compacted than expected,
that the basis for estimating the average value of γ
eq
(experience, tables, or charts) might be
biased, inappropriate or misinterpreted, and so forth.
If, in a particular instance, the value of LCV was judged to be 5.50 kN/m
3
, and the value
of HCV was judged to be 8.64 kN/m
3
, the standard deviation of γ
eq
would be 0.76 kN/m
3
,
calculated as follows:
864550
4
.
−
.
3
(3.18)
σ=
=
076
.
N/m
The COV of γ
eq
would be
076
707
.
.
(3.19)
COV =
=
11
%
3.5.6 graphical n-sigma rule
The concept behind the N-sigma rule can be extended to situations where the parameter
of interest, such as strength, varies with depth or pressure. Examples are shown in
Figures
The graphical N-sigma rule (with
N
σ
= 2) is applied as follows:
1. Draw a straight line or a curve through the data that represent the most likely average
variation of the parameter with depth or pressure.
2. Draw straight lines or curves that represent the highest and lowest conceivable bounds
on the data. These should be wide enough to include all valid data and an allowance
for the fact that the natural tendency is to estimate such bounds too narrowly, as
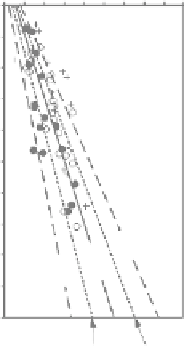
Undrained shear strength - Su (kPa)
0
50
90
-6
-12
Undrained shear strength versus
depth for San Francisco Bay mud
-18
-24
-30
-36
AVE - σ AVE + σ
Figure 3.14
Development of average plus one standard deviation and average minus one standard deviation
variations of Su with depth using the 2
σ
rule. (After Duncan, J.M., and Buchignani, A.L. 1973,
'Failure of underwater slope in San Francisco Bay',
Journal of the Soil Mechanics and Foundations
Division, ASCE
, Vol. 99, No. 9, p. 687-703. Used with permission from ASCE.)


Search WWH ::

Custom Search