Environmental Engineering Reference
In-Depth Information
6.00
5.00
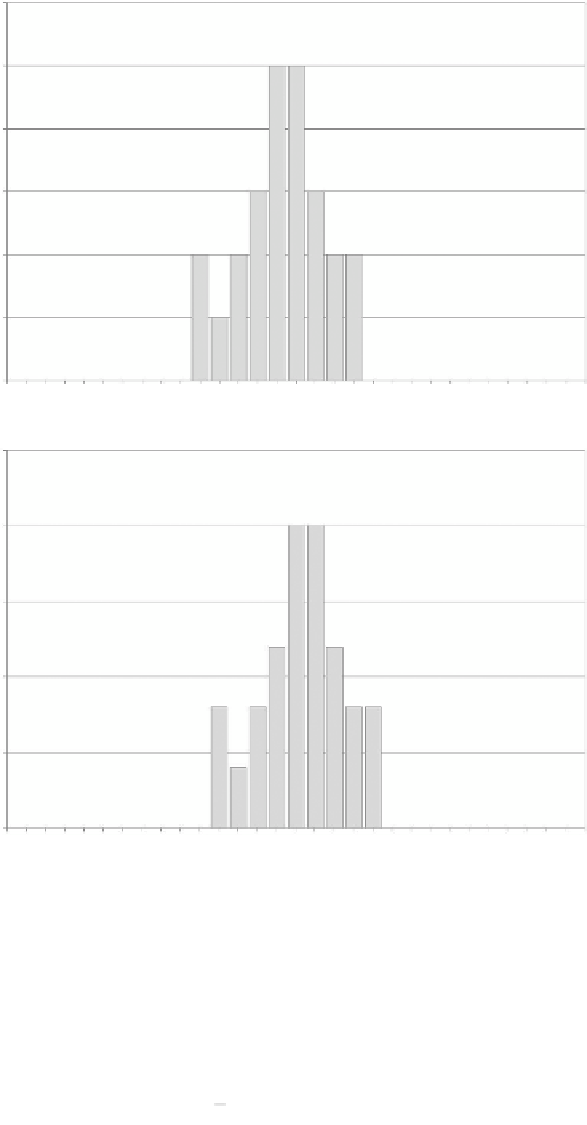
Histogram
4.00
3.00
2.00
1.00
0.00
0
5
10
Measured values of
s
u
(sorted into 1 kPa bins) — (kPa)
15
20
25
30
0.25
0.20
Relative frequency diagram
0.15
0.10
0.05
0.00
0
5
10
Measured values of
s
u
(sorted into 1 kPa bins) — (kPa)
15
20
25
30
Figure 3.2
Histogram and relative frequency diagram of undrained shear strength data shown in
Table 3.1.
3.3.8 normal and lognormal distributions
The normal distribution is a symmetrical bell-shaped curve, with the peak at the average
value. The normal probability distribution is given by
Equation 3.4
2
1
2
1
2
xx
−
Normal
px
()
=
exp
−
(3.4)
σ
σπ
where
p
(
x
) is the probability of a particular value of
x

Search WWH ::

Custom Search