Environmental Engineering Reference
In-Depth Information
Hence, the bivariate PDF of (Y
5
, Y
6
) is
yb
a
−
yb
a
−
5
Y
5
6
Y
6
fy
(,y)
=
f
x
= +×
b
a
sinh
−
1
,
x
=
ba
+
×
si
nh
−
1
Y
56
X
5
X
5
X
5
6
X
6
X
6
Y
5
Y
6
d
dy
x
d
dy
x
×
5
5
×
6
6
(1.121)
Before the conditioning,
0
0
1001
0011
.
=
ˆ
Š
'
'
=
µ
[]
1
[]
11
C
(1.122)
.
The updated mean vector and covariance matrix have been computed in
Equations 1.115
and 1.116:
−
0 769
0 0189
.
0 359
.
0
.
204
[]
1
[]
1
[]
11
[]
11
µµ
=
=
CC
=
=
(1.123)
update
update
.
0 204
.
0 451
.
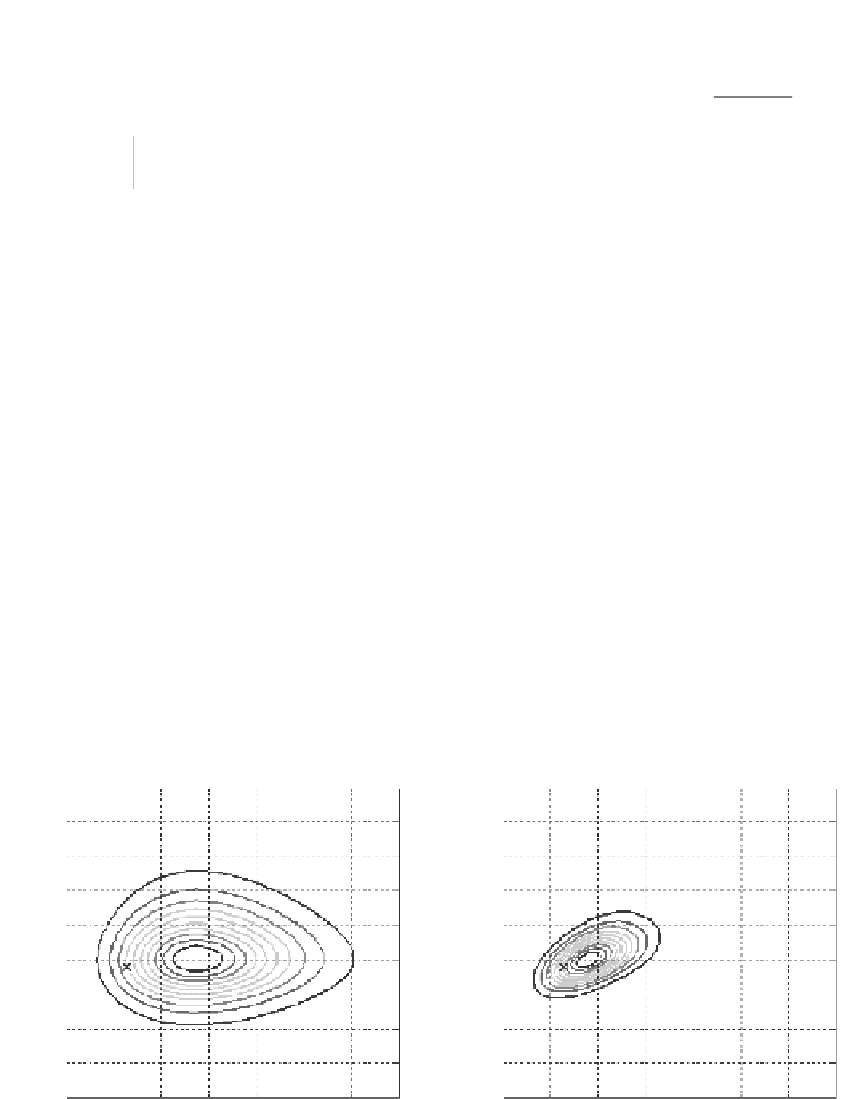
The cross-symbol in the figure indicates the actual measured values of (Y
5
, Y
6
). The reduc-
tion in the scatter is even more pronounced in
Figure 1.36
than in
Figure 1.35
.
(a)
4
(b)
4
3
3
2
2
1
1
0
0
-1
-1
-2
-2
-3
-3
-4
-4
-5
-5
-2
-1
0
1
2
3
4
5
-2
-1
0
1
2
3
4
5
Y
5
= ln(σ′
p
/
P
a
)
Y
5
= ln(σ′
p
/
P
a
)
Figure 1.36
Unconditional and conditional bivariate PDFs of (Y
5
, Y
6
), based on the information Y
3
=
1.793,
Y
4
=
−
0.912 , Y
8
=
0.504, and Y
10
=
1.265; (a) unconditional PDF and (b) conditional PDF. (The
cross indicates actual measured values of (Y
5
, Y
6
) reported by Rochelle, P.L., Zebdi, M., Leroueil,
S., Tavenas, F., and Virely, D. 1988.
Proceedings of the 1st International Symposium on Penetration
Testing
, Orlando, 2, 831-841.)
Search WWH ::

Custom Search