Information Technology Reference
In-Depth Information
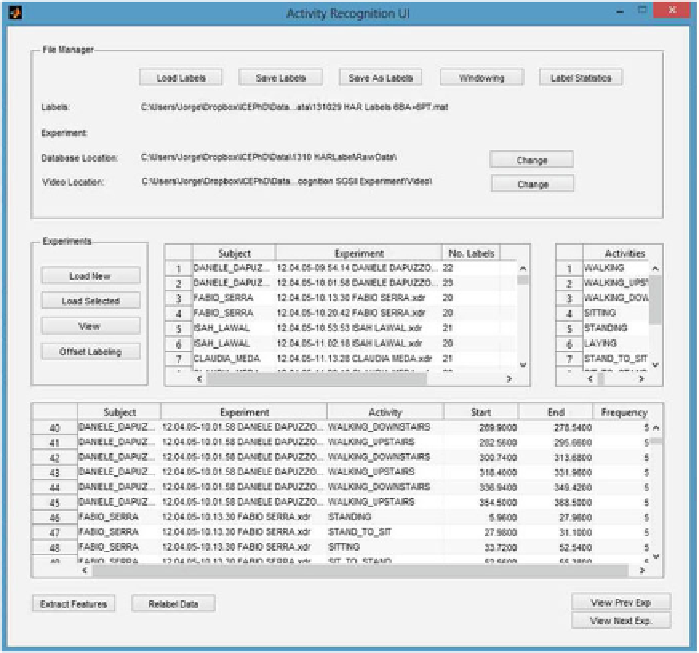
4.3 HAR Data Processing
Once data were collected from the experiment, log files and video footage were
handled in order to generate the HAR datasets. We developed an application for this
purpose (
ARGUI
). It was written in
Matlab
by means of its Graphical User Interface
(GUI) tool. Figure
4.6
shows a screenshot of the main interface in which it is possible
to visualize the collection of HAR experiments and the main functions available. The
main steps involve: activity labeling, signal processing and feature mapping. These
are all described in this section.
4.3.1 Labeling
Data were labeled manually and guided by the video footage recorded during the
experiment execution. The first step consisted on synchronizing the video and inertial
signals. This task was done aided by the user interface which allowed to visually
Search WWH ::

Custom Search