Information Technology Reference
In-Depth Information
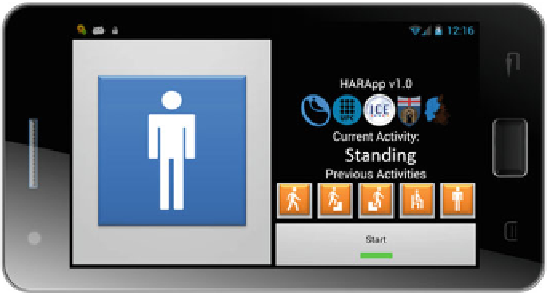
Fig. 7.5
HARApp smartphone user interface
7.5 Results
In this sectionwe present the experimental results obtained for the twoHARmethods.
For this, we make use of the error metric defined in Sect.
7.4
. We have divided this
evaluation first by giving a global overview of the methods performance and then we
go further into detail with the analysis of the activities through the use of confusion
matrices and measures of specificity and sensitivity.
7.5.1 System Error Evaluation
To evaluate the performance of the proposed methods, we took our previous L-HAR
system presented in Chap.
6
as a reference point. This is is equivalent to PTA-HAR
system with the PTA-6A method without applying temporal activity filtering. We
first learned the
D
2
T
dataset which only considered the 6 BAs and was generated
using
Then, we applied the same procedure to
2
window sampling, and obtained an recognition error of 7.72% using the proposed
error metric. This showed an increase of the system error by 4.33% points mainly
due to the misclassifications that occurred in PTs. This finding showed how the first
offline approach fails to work online when it is under a large number of transitory
events between activities such as PTs. In this dataset they cover nearly 9% of the
available data. Although this is a rather small portion, it is influential in the overall
system performance.
Henceforth, we consider separately the effect of PTs and BAs in the system and
work only on the
D
3
T
, which contains PT labels and
W
D
3
T
dataset. We assessed the two proposed methods (PTA-6A
and PTA-7A). This evaluation is presented in Table
7.2
where we include the overall
system error and also the error of intermediate stages of the processing. In this way, it

Search WWH ::

Custom Search