Game Development Reference
In-Depth Information
Cooperate
Defect
3
12
Cooperate
3
0
0
1
Defect
12
1
Figure 11
. A chart of the prisoner's dilemma; the numbers stand for the number
of months in jail associated with each alternative. (The numbers used are arbi-
trary as long as the relative values of each outcome are maintained.)
the other out, they each get one month in jail. If they both betray each
other, they each get three months in jail. If one keeps quiet and one rats
the other out, the one that snitched goes free and the other one gets an
entire year in jail. Dilemmas such as these are often laid out in charts like
Using a chart like this to lay out all possible outcomes and assign a
number to the value of each outcome for a given player can be an effec-
tive process for balancing games, since this method allows you to quan-
tify values for different moves in your system. Let's quickly draw up a
game—perhaps we could call this one the
Street Fighter
's
dilemma
.
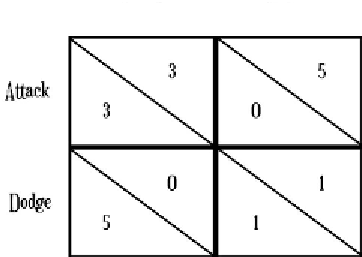
This is, of course, a very simple example, but the chart does allow
you to see how the two choices—attack or dodge—seem to work. The
Attack
Dodge
3
12
Attack
3
0
0
1
Dodge
12
1
Figure 12.
he
Street Fighter
's dilemma.