Biomedical Engineering Reference
In-Depth Information
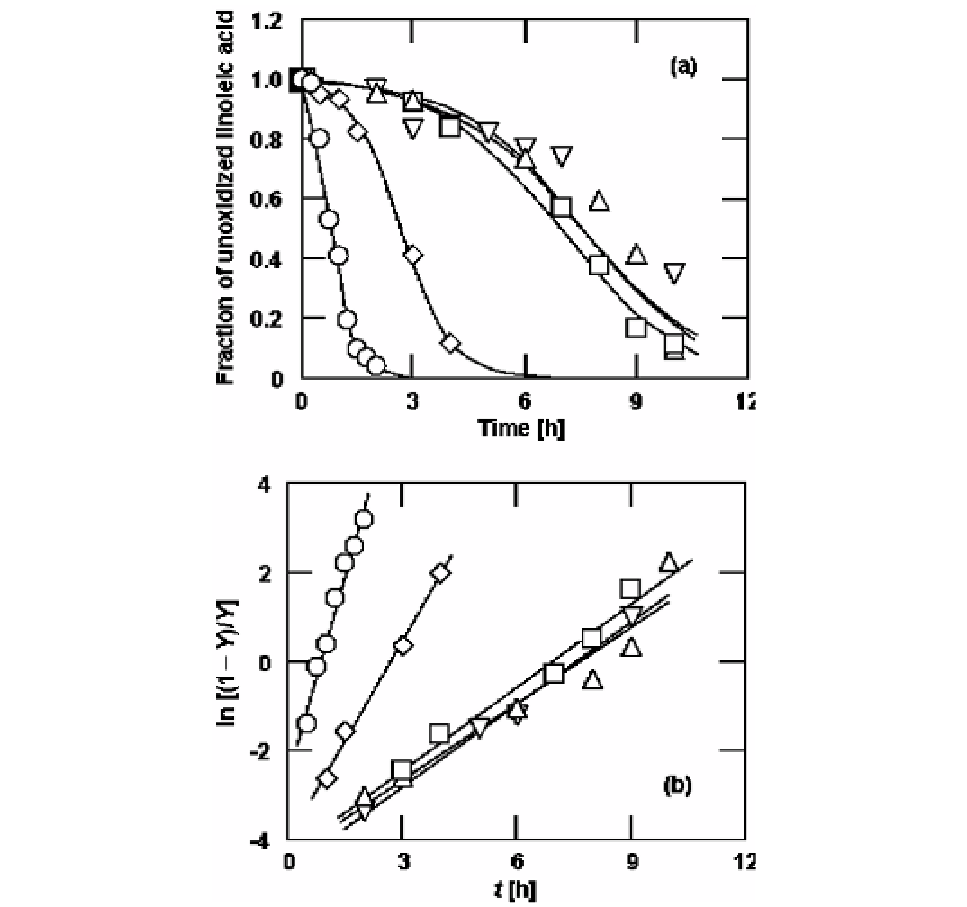
Figure 17. (a) Oxidation processes of (
{
) linoleic acid with no additive and that mixed with (
)
ascorbic acid, (
) octanoyl ascorbate, (
U
) lauroyl ascorbate or (
V
) palmitoyl ascorbate at the molar
ratio = 0.05 and at 80
o
C. The solid curves were drawn using the
k
and
Y
0
values estimated in Figure
17(b); (b) Determination of the rate constant,
k
, in the rate expression of the autocatalytic type at 80
o
C
and with the molar ratio = 0.05. The symbols are the same as those in Figure 17(a).
Y
denotes the
fraction of unoxidized linoleic acid. The solid curves were drawn based on Eq. 10.
where
Y
0
is the initial fraction of unoxidized substrate and determines the induction period
due to the mathematical nature of the equation. The applicability of Eq. 9 to the oxidation
processes of linoleic acid mixed with various ascorbates was examined. Linear plots of ln [(1-
Y
)/
Y
] versus
t
for the oxidation process are shown in Figure 17(b). Based on a linear
regression analysis, the
k
and
Y
0
values were determined from the slope and the intercept,
respectively. The
k
and
Y
0
values for the oxidation processes of linoleic acid at 37, 50 and
65
o
C were also estimated in the same manner. Figure 18 shows the relationship between the
acyl chain length of the ascorbates and the
k
value at various temperatures. At any
temperature, the
k
value for linoleic acid with no additive was greater than that for LA with
ascorbic acid or ascorbate. When octanoyl, lauroyl or palmitoyl ascorbate was added to