Biomedical Engineering Reference
In-Depth Information
4. Results and Discussion
4.1. Experiments under the Same Initial pH Value (T = 24.6
o
C, pH = 6.5)
For each algae, the parameters μ,
K
and the initial biomass concentration,
n
0
, were
determined by fitting the logistic equation to the experimental results, using the non-linear
least squares technique. Adjusting
n
0
allows overcoming high experimental errors associated
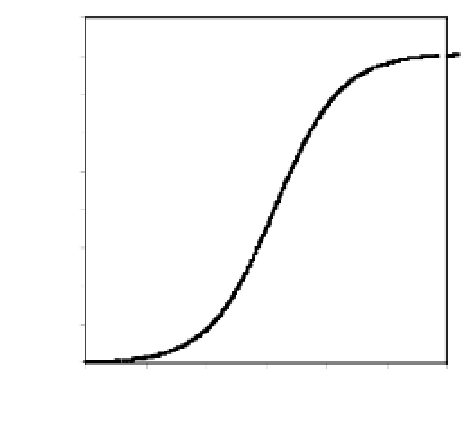
with the measurement of low biomass concentrations. The growth curve obtained for all algae
species involved in this study are shown in Figure 1. All curves present a similar growth
pattern, although
Scenedesmus acutus
growth seems to increase after 150 h operation and
Chlorella fusca
shows a slower growth rate in the beginning.
450
400
n
0
= 1.19 mg l
-1
μ
= 0.0370 h
-1
K
= 403.3 mg l
-1
R
2
= 0.996
400
n
0
= 6.15 mg l
-1
μ
= 0.0284 h
-1
K
= 369.2 mg l
-1
R
2
= 0.997
350
350
300
300
250
250
200
200
150
150
100
Chlorella Fusca
100
Chlorella Vulgaris
50
50
0
0
0
50
100
150
200
250
300
0
50
100
150
200
250
300
Ti m e ( h )
Ti m e ( h )
600
500
450
n
0
= 2.03 mg l
-1
μ
= 0.0359 h
-1
K
= 542.9 mg l
-1
R
2
= 0.999
600
500
500
400
400
300
350
400
200
10 0
300
0
300
250
0
100 200 300 400 500
200
n
0
= 15.88 mg l
-1
μ
= 0.0162 h
-1
K
= 604.1 mg l
-1
R
2
= 0.995
200
150
Scenedesmus Acutus
100
100
50
Scenedesmus Obliquus
0
0
0
50
100
150
200
250
300
0
50
100
150
200
250
300
Ti m e ( h )
Ti m e ( h )
Figure 2. Microalgal growth (▲) as a function of time. (—) Logistic model fittings (T = 24.6 ºC;
pH = 6.5).
Growth curves obtained for each algae by fitting the logistic equation to the experimental
data are also presented in Figure 2.
Scenedesmus acutus
and
Chlorella fusca
show higher lag