Biology Reference
In-Depth Information
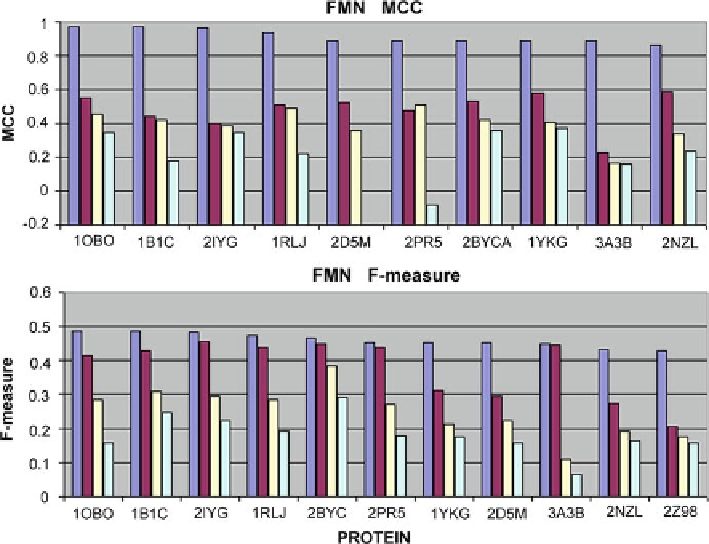
Fig. 4.14
MCC and F-measure scores for FMN-complexing proteins correctly processed by most
of the analyzed tools. Only the top four scores have been taken into account for each program
Top row - FMN-binding proteins
Left column - Example protein (3F2V) for which FOD incorrectly identifies
ligand binding residues (Table
4.6
) The catalytic residue represents the global minimum
of the
Δ
H
pro fi le, i.e. excess hydrophobicity on the protein surface. This residue
has been correctly identified as involved in catalytic activity.
Right column - Example protein (2NZL) for which FMN binding residues have
been correctly identified. The distribution of catalytic residues suggests correct
identification of the enzymatic active site, consisting of amino acids to which the
FOD model attributes hydrophobicity deficiencies.
Bottom row - NAD
+
-binding proteins
Left column - Example protein (1BMD) for which FOD incorrectly identifies
ligand binding residues. Enzymatically-active residues represent local maxima of
the
Δ
H
profile, which could be useful in identifying the corresponding catalytic
active site.
Right column - Example protein (1 AD3) for which FOD incorrectly identifies
ligand binding residues. The distribution of catalytic residues suggests correct
identification of the enzymatic active site, consisting of amino acids with peak
Δ
H
values.
Search WWH ::

Custom Search