Biology Reference
In-Depth Information
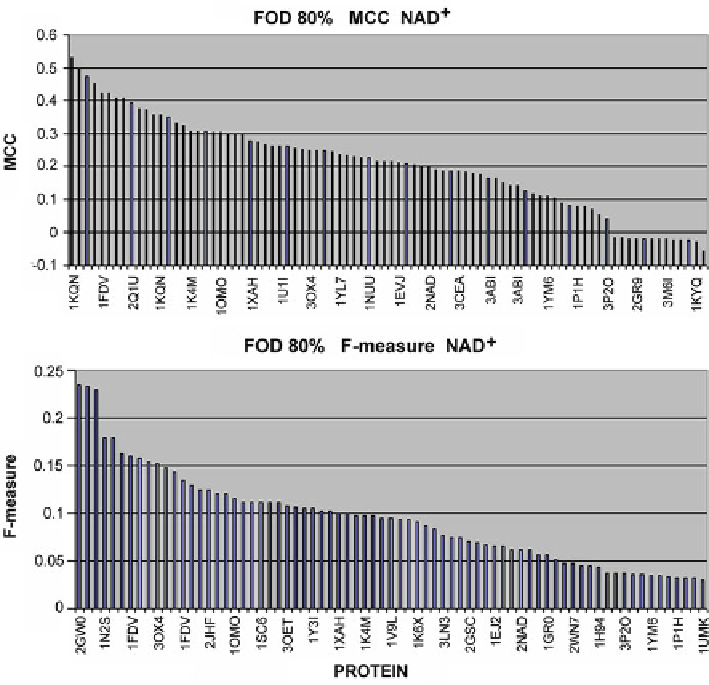
Fig. 4.5
Comparison of MCC and F-measure results for NAD
+
-complexing proteins as reported
by the FOD model. The cutoff threshold was established at 80 %, meaning that only values beyond
80 % of the maximum were considered valid
The PocketFinder tool also produced high MCC values for most of the tested
proteins, with only two molecules ranked below 0 (Fig.
4.8
). As with most other
software packages, F-measure scores are somewhat more diverse than MCC results,
although they remain comparable (falling between 0.2 and 0.3 in most cases).
The QSiteFinder tool identified a relatively numerous group of proteins with
high MCC and F-measure scores - notably a set of molecules for which MCC values
are in the 0.4-1.0 range (Fig.
4.9
). These results are supported by the corresponding
F-measure scores.
4.5.2.2
Knowledge-Based Packages
Consistent F-measure results were obtained by applying the ConSurf package.
Good agreement between MCC and F-measure scores indicates high reliability
of evolutionary methods in the context of FMN-complexing proteins (Fig.
4.10
).
Search WWH ::

Custom Search