Biology Reference
In-Depth Information
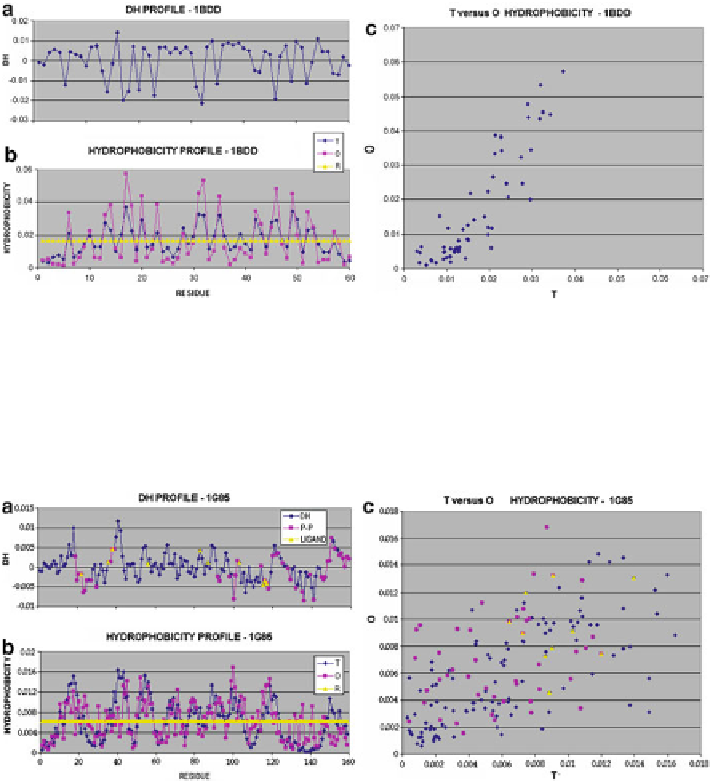
Fig. 3.1
Hydrophobicity distribution profiles for protein 1BDD whose hydrophobic core is structur-
ally accordant with the assumed model: (
a
) differences between expected and observed hydrophobic-
ity; (
b
) theoretical (
T
) and observed (
O
) and random (
R
) hydrophobicity distributions; (
c
) relation
between theoretical (
T
) and observed (
O
) hydrophobicity values.
Pink squares
represent residues
involved in protein complexation;
yellow triangles
represent residues involved in ligand binding
Fig. 3.2
Hydrophobicity distribution profiles for protein 1 G85 whose hydrophobic core is structur-
ally discordant with the assumed model: (
a
) differences between expected and observed hydropho-
bicity; (
b
) theoretical (
T
), observed (
O
) and random (
R
) hydrophobicity distributions; (
c
) relation
between theoretical (
T
) and observed (
O
) hydrophobicity values;
Pink squares
represent residues
involved in protein complexation;
yellow triangles
represent residues involved in ligand binding
Of note is the arrangement of points representing the relation between expected
(T) and observed (O) hydrophobicity distributions: for 1BDD they follow a linear
pattern and exhibit little variance, while for 1 G85 their relative spread is much
greater. This phenomenon is most likely caused by residues responsible for molecular
interactions, present in 1 G85.
Search WWH ::

Custom Search