Biology Reference
In-Depth Information
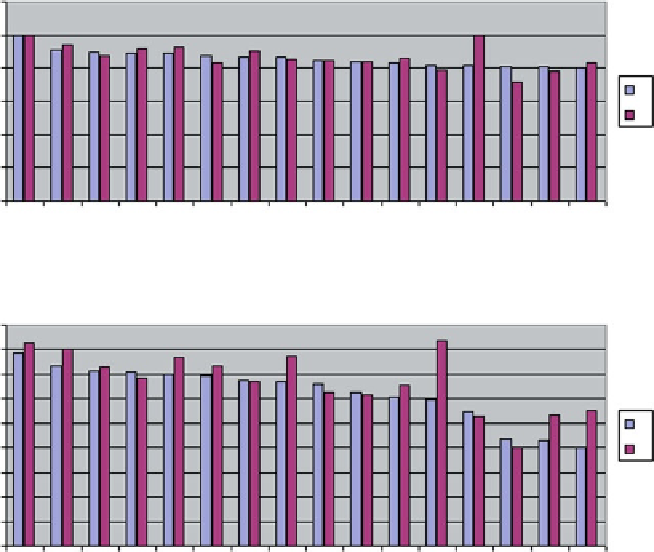
HADDOCK - MCC - BEST
1.2
1
0.8
0.6
A
B
0.4
0.2
0
HADDOCK - MCC - LOWEST
0.9
0.8
0.7
0.6
0.5
0.4
0.3
0.2
0.1
0
A
B
Fig. 6.11
Best (
top
) and worst (
bottom
) solutions produced by HADDOCK and ranked according
to the MCC criterion. 16 solutions are depicted for each case.
Colored bars
indicate differences
between individual protein chains (designated
A
and
B
)
interface is expected to be found). For a single pair of proteins with properly
established sets of candidate residues calculations take approximately 5 min. The
program is capable of generating up to 2,000 different complexes, although the list
may be restricted by the user - in our study we requested a list of 10 structures,
ranked according to their fitness scores (Fig.
6.14
).
6.4
Comparative Analysis
The goal of comparative analysis is to identify complexes which specifically
demonstrate the properties of a given computational tool and its underlying theo-
retical model. In order to highlight differences between models we have focused on
the best and worst structures produced by each application (according to F-measure
and MCC criteria). Table
6.2
presents a list of complexes which ranked among the
Search WWH ::

Custom Search