Biology Reference
In-Depth Information
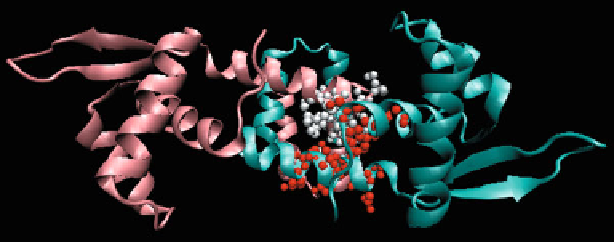
Δ
H
pro fi le maxima (
red
) are indicated for the A chain
(
turquoise
), while local minima (
white
) are highlighted in the B chain (
salmon
). In this case, inter-
acting residues mutually compensate their respective deviations from the idealized hydrophobicity
pro fi le
Fig. 6.9
The 1SD6 homodimer. Local
For each protein dimer HADDOCK generated ten possible conformations. From
these, the top three structures were further processed to determine which residues
form the complexation site (this step was based on custom scripts). Figure
6.10
illus-
trates the BEST and LOWEST solutions produced by HADDOCK, while Fig.
6.11
ranks the BEST and LOWEST structures in terms of their F-measure and MCC scores.
Of note is the high similarity of both rankings, differing only by a single item.
6.3.3
RosettaDock
The starting structure for RosettaDock was generated using Gramm-X (Protein-
Protein Docking Web Server v.1.2.0, Center for Bioinformatics of the University of
Kansas,
http://vakser.bioinformatics.ku.edu/resources/gramm/grammx
). This soft-
ware package applies FFT in its search for optimal structures. Input data consists of
the PDB protein structure and the numerical positions of amino acids which belong
to its complexation site (according to PDBsum). Gramm-X produces a ranked list
of structures, the topmost of which was selected as input for RosettaDock.
RosettaDock is based on a local docking algorithm which seeks out all confor-
mations in the vicinity of a user-specified starting point. All structural translations
are performed with a step of approximately ±3 Å in the longitudinal plane and ±8 Å
in the lateral plane. Rotations apply a step of 8° and cover the entire 360° angle around
the geometric centers of participating structures. A total of 1,000 independent simu-
lations were performed for random conformations (i.e. random steric adjustments).
Results were ranked according to their total free energy and the highest ranked
structure was selected for further processing. Its complexation site was thoroughly
mapped (by applying the PDBsum distance criterion) using custom scripts.
Complexation site mapping relied on the distance between individual monomers,
with cutoff distances derived from PDBsum.
Search WWH ::

Custom Search