Biology Reference
In-Depth Information
-
-
Δ
H
profile and contact map
Δ
H
profile and contact map
0.02
Protein
Protein
0.015
0.015
0.01
0.01
0.005
0.005
0.0
0.0
-0.005
-0.005
-0.01
-0.01
0
20
40 60
Residue
Protein contact identification ROC curves
80
100
0
20
40
60
80
100
Residue
Protein contact identification ROC curves
1.0
1.0
-
-
Δ
H
≥
0.0
-
Δ
H
≤
0.0
Δ
H
≥
0.0
-
Δ
H
≤
0.0
0.8
0.8
0.6
0.6
0.4
0.4
0.2
0.2
0.0
0.0
0.0
0.2
0.4
0.8
0.6
False Positive Rate
1.0
0.0
0.2
0.6
False Positive Rate
0.4
0.8
1.0
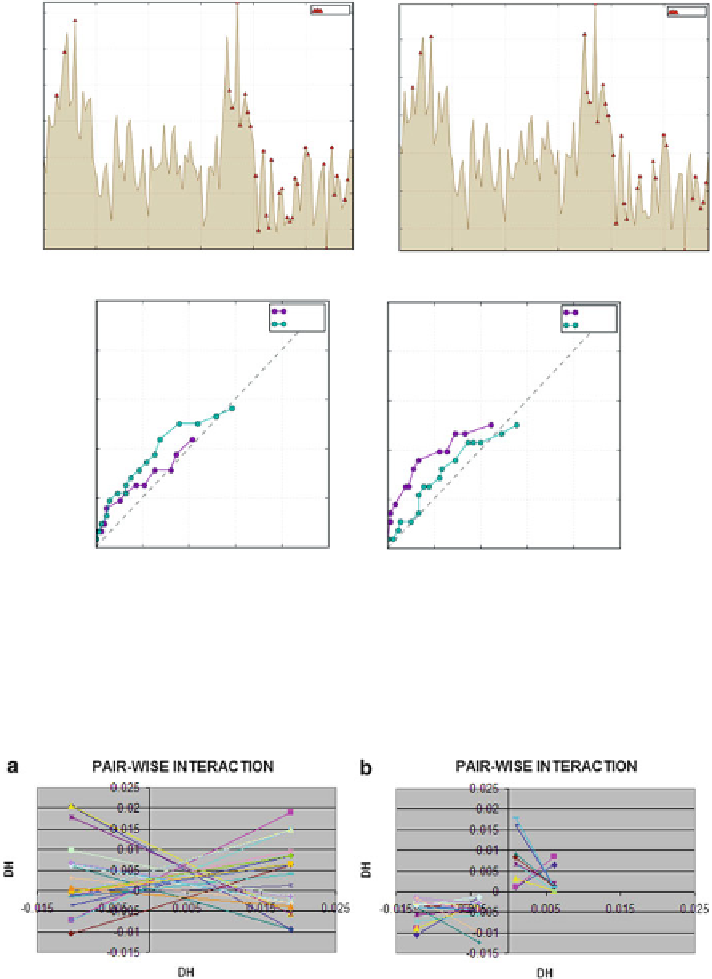
Δ
H
profiles for both chains of the 1SD6 homodiner, indicating residues which represent
excess hydrophobicity as well as local hydrophobicity deficiencies. In this case areas of excess
hydrophobicity appear to be paired with areas of low hydrophobicity of the surface of the partner
molecule. This suspicion is further confirmed by analysis of the 3D representation of 1SD6
Fig. 6.7
Fig. 6.8
Pairwise interactions in the 1SD6 homodimer. (
a
) Pairs of residues with complementary
(
mirrored
) deviations from the idealized profile (positive and negative values of
Δ
H
); (b) Pairs
Δ
H
values. Note that interaction
where both participating residues have identically signed
Δ
H
values indicates shared hydrophobicity excess, while pairing
between residues with negative
Δ
H
values corresponds to shared hydrophobicity deficiencies. Scale is
preserved between fi gures to enable quantitative comparisons
of residues with positive
Search WWH ::

Custom Search