Biology Reference
In-Depth Information
-
Δ
H
profile and contact map
Protein contact identification ROC curves
1.0
Protein
-
0.006
Δ
H
≥
0.0
-
Δ
H
≤
0.0
0.8
0.004
0.6
0.002
0.0
0.4
-0.002
0.2
-0.004
0.0
50
100
150
200
250
300
0
0.0
0.6
False Positive Rate
0.8
1.0
0.2
0.4
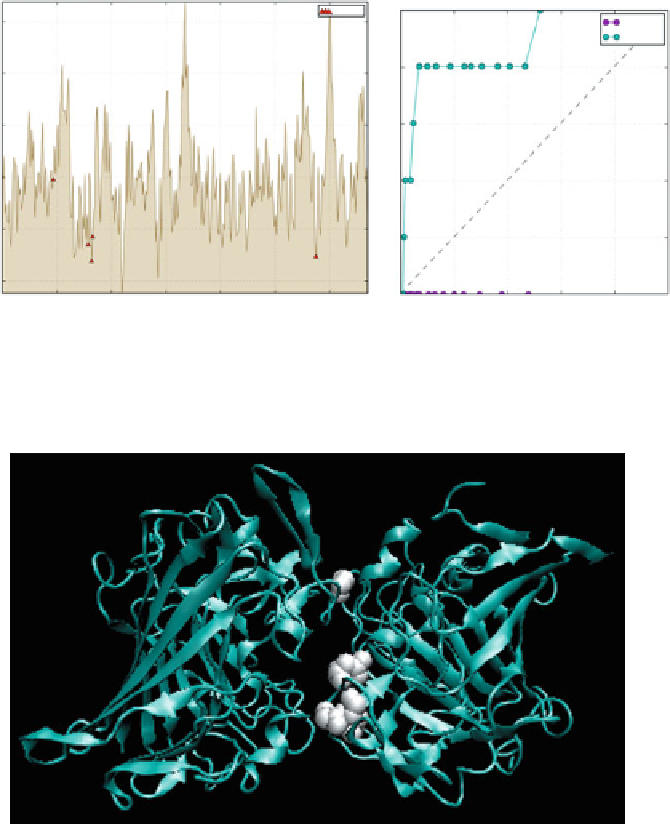
Residue
Δ
H
profile of the 1YGA homodimer, indicating residues involved in complexation
(
left
). The graph on the
right-hand side
shows the ROC curve corresponding to profile minima
(excess hydrophobicity) and indicates the relation between TPR and FPR for this homodimer
Fig. 6.5
Fig. 6.6
The 1YGA homodimer.
White spheres
in the A chain indicate residues which correspond
to local
Δ
H
profile minima (excess hydrophobicity), such as Val and Cys. The presence of such
residues on the molecule surface enables the model to accurately identify complexation sites
6.3.2
HADDOCK
HADDOCK computations were performed using the web service available at
http://
data consisted of PDB files describing “active” amino acids. The Gramm-X prepro-
cessing package (Tovchigrechko and Vakser
2006
) was not used. HADDOCK
works by optimizing binding energy values in a six-dimensional space (three transla-
tions + three rotations). The “passive amino acid” option was skipped.
Search WWH ::

Custom Search