Biology Reference
In-Depth Information
Table 6.1
Summary of most accurate complexation site predictions
Δ
H
< 0
PDB ID Chain Surface PDB ID Chain Surface
1TR8 A 0.742 1YGA B 0.82
1TR8 B 0.714 1YGA A 0.78
1G8M A 0.609 3GYZ A 0.56
3CRN A 0.573 1 G85 A 0.536
2ARV A 0.550 2QM8 A 0.508
2R52 B 0.543 1 T09 A 0.471
1G8M B 0.542 1 T09 B 0.453
3GYZ A 0.527 2E1N A 0.438
1HDF B 0.511 2WCI A 0.436
1HUX B 0.467 2FJT A 0.427
1HUX A 0.457 2FJT B 0.425
2A9U B 0.449 2ARV B 0.405
1 V58 A 0.447 1BFT A 0.381
3FYF A 0.442 2QM8 B 0.378
2A9U A 0.431 1BFT B 0.375
1FZV A 0.430 1SD4 A 0.368
The ranking criterion is the surface area bounded by the ROC curve (placed above the diagonal in
the TPR/FPR relation graph - see Fig.
6.3
) and the corresponding diagonal
Δ
H
pro fi le for
Δ
H
> 0
Δ
H
pro fi le for
-
Δ
H
profile and contact map
Protein contact identification ROC curves
1.0
0.03
-
Δ
H
≤
0.0
Protien
-
Δ
H
≥
0.0
0.8
0.02
0.6
0.01
0.4
0.0
0.2
-0.01
0.0
0.0
0
20
30
40
80
0.2
0.4
0.6
0.8
1.0
Residue
False Positive Rate
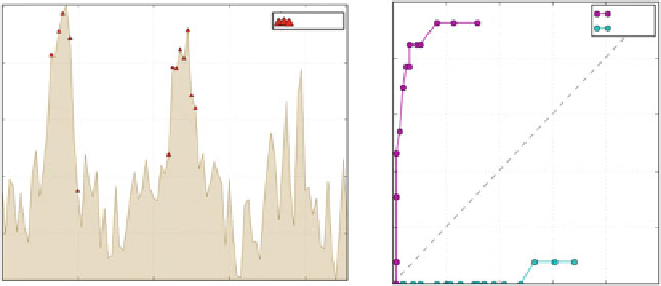
Δ
H
profile of the 1TR8 homodimer, indicating residues involved in complexation (
left
).
The graph on the
right-hand side
shows the ROC curve corresponding to profile maxima (hydro-
phobicity deficiencies). The relatively large area bounded by this curve and the diagonal reflects
excellent accordance with theoretical predictions and - correspondingly - high accuracy of results
Fig. 6.3
This is true e.g. for the 1TR8 homodimer, which provides a particularly good example
of the presented mechanism (Spreter et al.
2005
) . Figure
6.3
depicts its
Δ
H
pro fi le,
indicating which residues are involved in complexation and presenting the corre-
sponding ROC curve plotted on the FPR/TPR graph, where the surface area bounded
by the curve and the diagonal is appropriately large (74% of the unit triangle).


Search WWH ::

Custom Search