Biology Reference
In-Depth Information
repeated for several distinct cutoff values (e.g. 80%), resulting in a set of TP/FP
ratios, as well as the corresponding TN/FN ratios, calculated in an analogous manner.
ROC curves may be applied to quantitative analysis of the results produced by the
“fuzzy oil drop” model for various
Δ
H
cutoff levels (Fawcett
2006
) .
Below we discuss the accuracy of results produced by various tools, listed in
alphabetical order.
6.3.1
Fuzzy Oil Drop Model
Figure
6.2
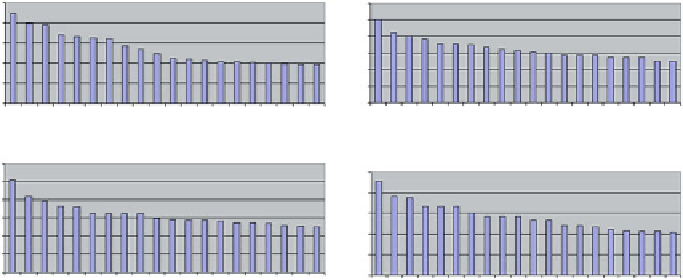
presents a summary of results generated by the “fuzzy oil drop” model,
in terms of F-measure and MCC criteria. Additional numerical data can be found in
Table
6.1
. Since the MCC and F-measure values depend on the assumed cutoff
level, all calculations assumed a threshold of 80% (meaning that residues are
identified as participating in complexation if their corresponding
Δ
H
values are
between 80 and 100% of peak levels).
The identification method based on the “fuzzy oil drop” model, when used to
pinpoint a single complexation site, produced the following results: for
Δ
H
of 80%
(−) - 35 and 25% on the F-measure and MCC scales respectively, and for
Δ
H
o f
80% (+) - 37 and 30% on both scales. Due to the large number of low-ranked results
(with an aggregate score of 0), the LOWEST category has been omitted. The 80% (-)
and 80%(+) denotes the 80% level for local maxima and local minima respectively.
It should be noted that, when applying a cutoff level, the set of true positives (TP)
usually includes all amino acids directly adjacent to the target residue, even when these
amino acids are not directly engaged in complexation. This makes the FP biased.
According to the model, residues which represent local
Δ
H
pro fi le minima possess
excess hydrophobicity compared to theoretical predictions, while
Δ
H
pro fi le minima
correspond to hydrophobicity deficiencies. Thus, the former can be expected to
seek out similarly conditioned residues on the surface of the partner molecule.
FOD F-measure 80+ BEST
FOD MCC 80- BEST
0.5
0.3
0.25
0.4
0.3
0.2
0.15
0.2
0.1
0.05
0.1
0
0
FOD MCC 80+ BEST
FOD F-measure 80- BEST
0.6
0.25
0.5
0.2
0.4
0.3
0.2
0.1
0
0.15
0.1
0.05
0
Fig. 6.2
Comparison of F-measure and MCC values for the “fuzzy oil drop” model. The assumed
cutoff level was 80% of either the highest or the lowest value of the
Δ
H
pro fi le
Search WWH ::

Custom Search