Environmental Engineering Reference
In-Depth Information
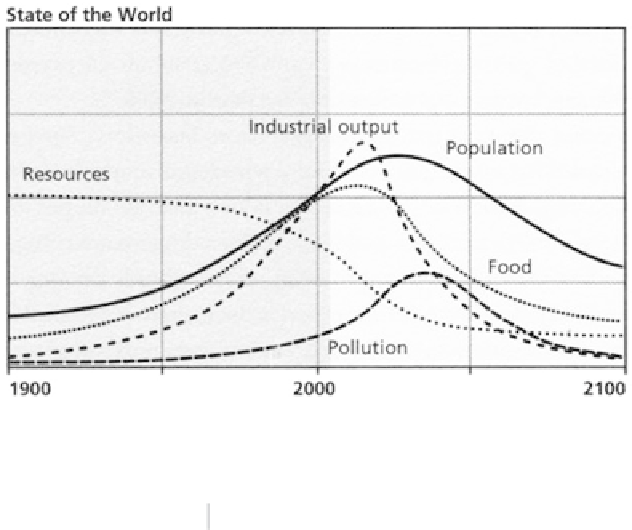
Fig. 3.1
Original “Limits to Growth” projections. (Redrawn from Meadows et al.
1972
)
Table 3.1
Growth rate during the
last 50 years. (Meadows et al.
2004
)
Item
1950
2000
Growth rate (%)
Population × 10
-6
2520
6060
240
Vehicles × 10
−6
70
723
1029
Oil × 10
−6
/barrel
380
27600
726
Electricity × 10
−6
(kW/h)
154
3240
2133
Wheat × 10
−6
/t
143
584
417
Rice × 10
−6
/t
150
598
399
Iron × 10
−6
/t
134
580
446
elements we take for granted in our current society, through the collision of contin-
ued exponential growth with finite limits at some point in the future.
The pace of this growth can be demonstrated by Table
3.1
(taken from the 2004
publication), which describes the growth during the last 50 years in various cat-
egories. Growth of over 10-fold is observed in vehicle number and over 20-fold in
electricity consumption. Such rates of growth raise the question whether we really
believe that such high growth is still possible in the next 50 years? Although some
researchers argue against the above prediction of clashing against limits, we must
eventually all reach some limit as the crew of Spaceship Earth, and this analysis
suggests that the limit might fall upon our next generation.
Before the dangerous future envisaged by such models becomes inevitable, we
have to act more effectively to realize a more sustainable society. Considering the
materials industries on which our whole economy relies, huge amounts of ener-
gy and resources are introduced and huge amounts of wastes are discarded to the
environment. This 'one-way' use of our natural resources would need to change