Environmental Engineering Reference
In-Depth Information
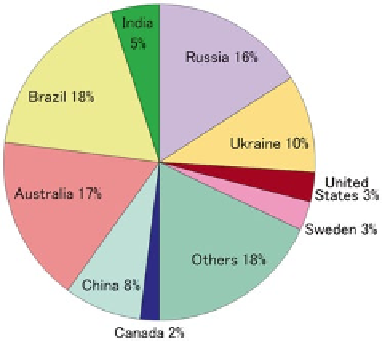
Fig. 12.7
Global distribution
of iron ore reserves. (US Geo-
logical Survey
2014
)
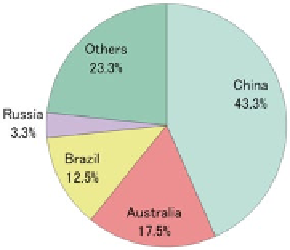
Fig. 12.8
Global distribution
of iron ore production. (Brit-
ish Geological Survey
2014
)
12.3
Distribution of Iron Ore Resources and Their
Trading
Figure
12.7
shows the outline of global distribution of iron ore reserves. More than
three quarters are held by a limited number of countries; Brazil, Australia, Russia,
Ukraine, China and India in that order (US Geological Survey
2010
). On the other
hand, China accounts for more than 43 % of the current iron ore production and is
followed by Australia, Brazil and Russia in that order (Fig.
12.8
; British Geologi-
cal Survey
2014
). The distribution of iron ore exports are shown in Fig.
12.9
(ISSB
2013
). Nearly 75 % is provided by two countries;- Australia and secondly Brazil.
China is the biggest iron ore mining and steel production country but it does not ap-
pear here since Chinese steel production far exceeds its iron ore production, and it
has thus become the largest importing country of iron ores.
The production of iron ores are influenced by very large several companies
known as major resource companies, which were established by recent megamerg-
ers and restructuring. Figure
12.10
shows the shares of iron ore seaborne trading