Information Technology Reference
In-Depth Information
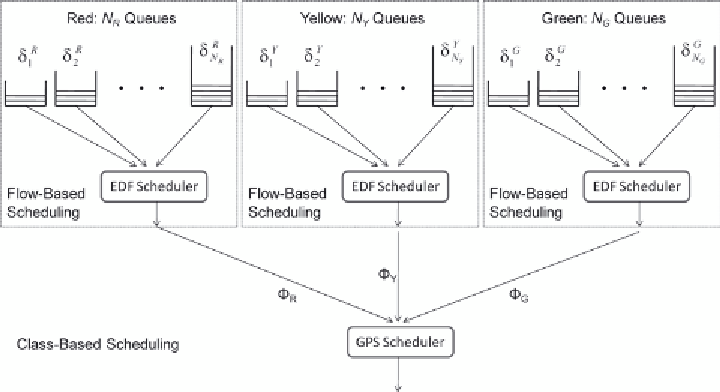
Figure 5. Hybrid Scheduler (HS)
This mechanism relies on the sink to record
statistical data, which includes the numbers of
packets and average delay per flow. This data is
then sent back to the source CHs to adjust their
weight triples (ϕ
R
, ϕ
Y
, ϕ
G
). To improve the ef-
ficiency, the statistic data is put into one packet
and periodically sent back to the corresponding
source CHs. Note that, as feedback packets fol-
low the reverse path from the sink to the source,
no additional routing overhead is needed. Finally
feedback information can be aggregated, using
techniques such as multicasting, which can fur-
ther reduce the overhead to route the feedback
information.
The problem of updating the triple (ϕ
R
, ϕ
Y
,
ϕ
G
) for a network with
N
B
CHs is actually a
stochastic network problem whose formulae for
the delays or reliability for each flow are hard to
derive. Our approach here is to use the following
numerical method, which is shown to provide
excellent results.
Suppose that the measured e2e reliability
γ
e
2
,
γ
e
2
,
γ
e
2
, and time difference
δ
e
2
,
δ
e
2
,
δ
e
2
between corresponding TTLs and the mea-
sured e2e delays are obtained from the sink's
feedback information. Our algorithm trades
γ
G
for
γ
R
and
γ
Y
in light congestion condition, and
γ
G
and
γ
Y
for
γ
R
in moderate congestion condition by
adjusting (ϕ
R
, ϕ
Y
, ϕ
G
), as shown in Algorithm 1,
where
α
R
,
β
R
,
β
Y
ϵ (0,1) are adjustment coefficients,
and ∆
e
2
, ∆
e
2
, ∆
e
2
are threshold values for
δ
e
2
,
δ
e
2
,
δ
e
2
, respectively. The complexity for
this algorithm is
O
(1).
As it is hard to derive the formulae for such a
stochastic network, trying to find the optimal ϕ
R
,
ϕ
Y
, and ϕ
G
is difficult. Our solution adjusts them
based on the network congestion status determined
from the feedback information. It is obvious that
we should trade the service to the 'yellow' (or
'green') traffic for the service to the 'red' (or
'yellow') traffic. Therefore, the coefficients for
the less important traffic are adjusted in a coars-
er manner and this is taken as a guideline for the
design of Algorithm 1. For example, if the network
is found to be in heavy congestion (Table 2), ϕ
R
is adjusted by adding half of ϕ
Y
(or ϕ
G
) while ϕ
Y
(or ϕ
G
) is adjusted by taking half of the original
value. If the network is found to be in intermedi-
ate congestion (Table 2), the algorithm first tries
to degrade the service to the 'green' traffic by
adding half of ϕ
G
. If there is no 'green' traffic to
degrade and the requirement for 'red' traffic is
satisfied, it then tries to increase ϕ
Y
by decreasing
ϕ
R
;
α
R
can be small so that the service to 'red'
Search WWH ::

Custom Search