Database Reference
In-Depth Information
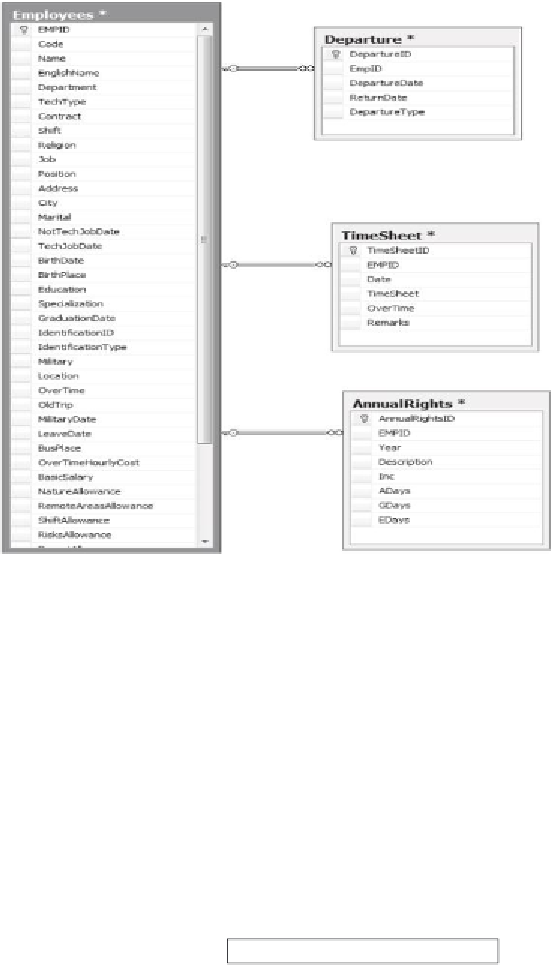
Figure 7.3
ER diagram for the timesheet system used in the implementation.
500
450
400
350
300
250
200
150
100
50
Rajwinder Singh
Proposed
0
0
20
40
60
80
100
Arrival Rate
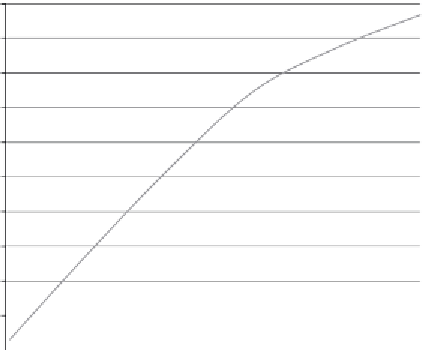
Figure 7.4
The impact of varying the arrival rates on the response times of the enhanced secure
multiversion concurrency control model and the Rajwinder Singh model.


Search WWH ::

Custom Search